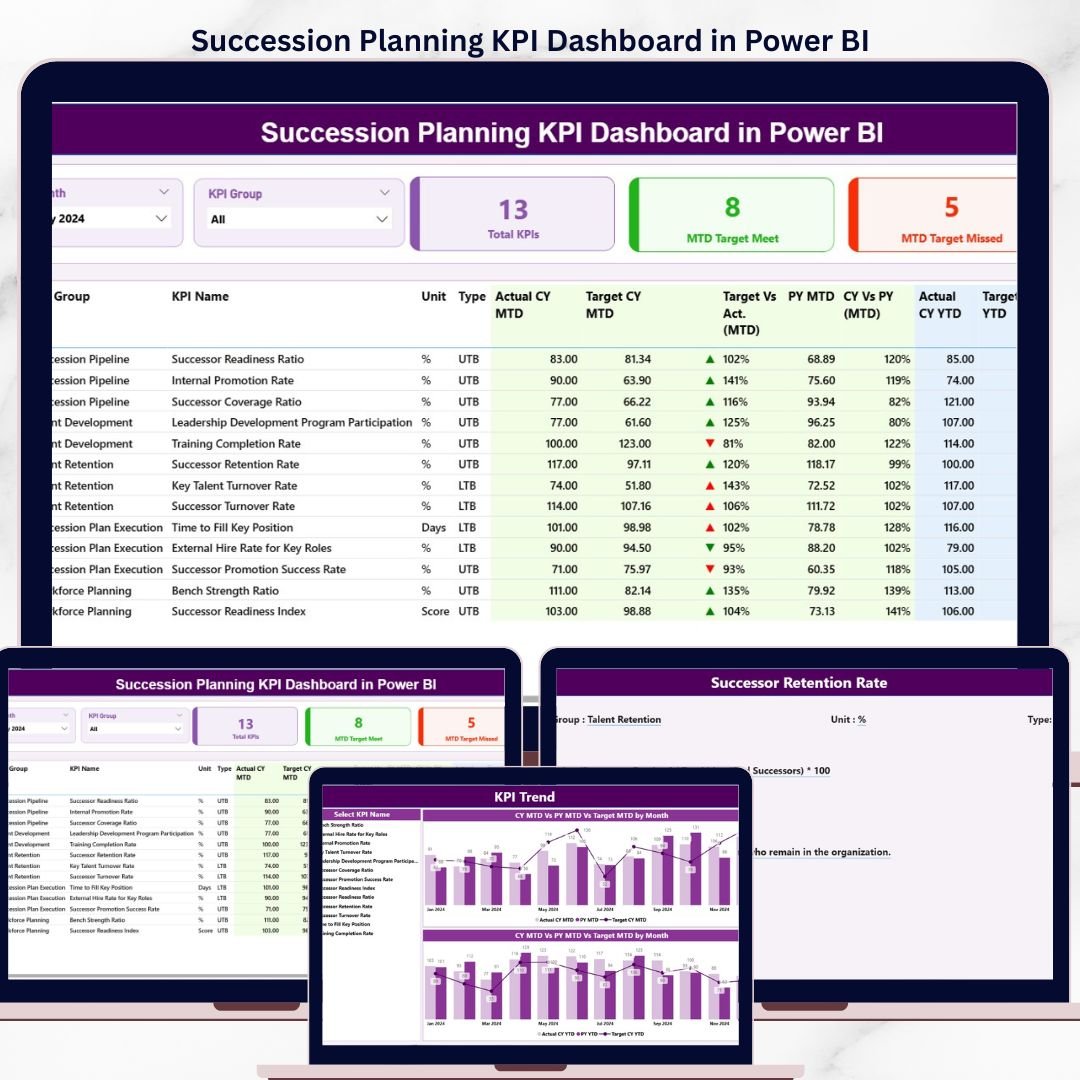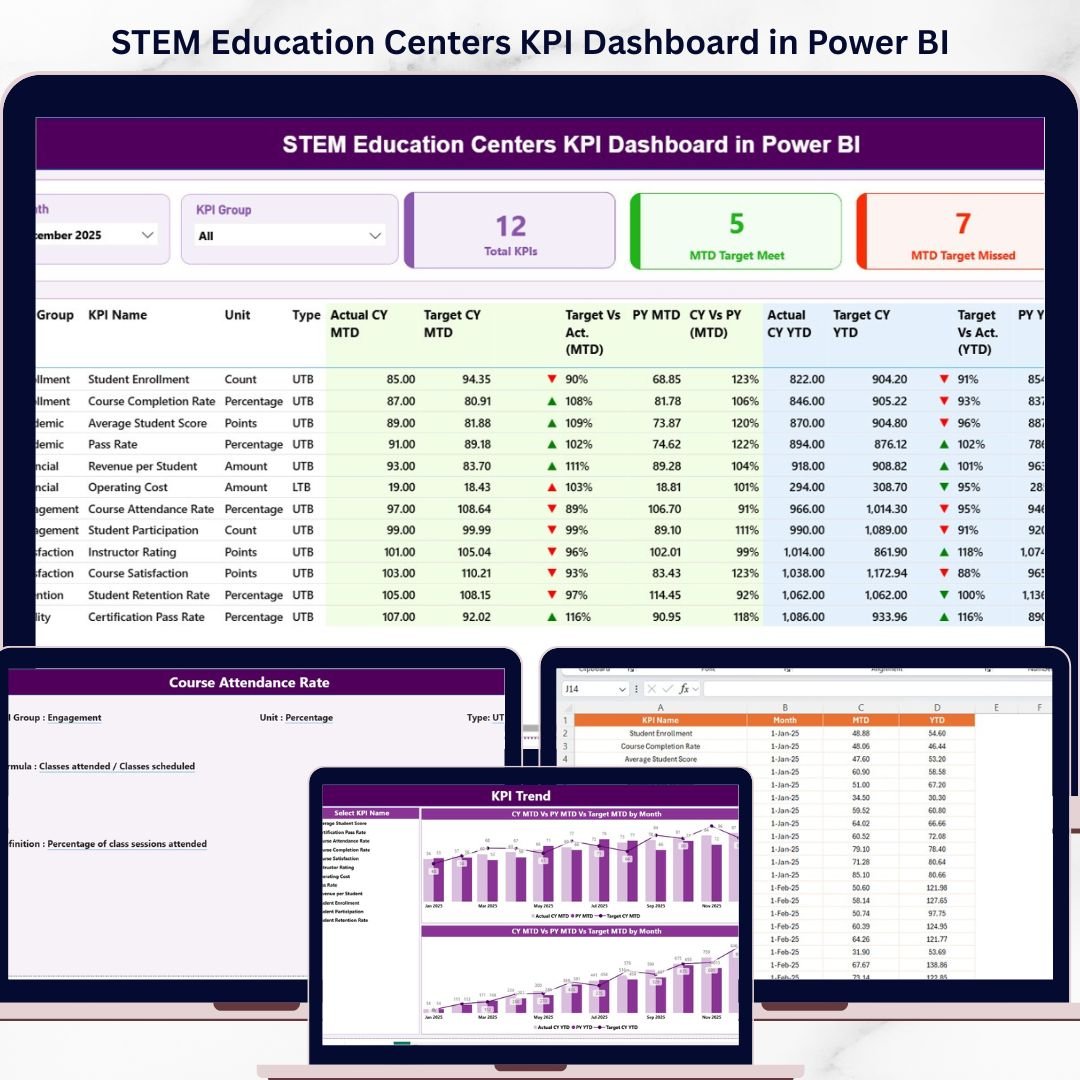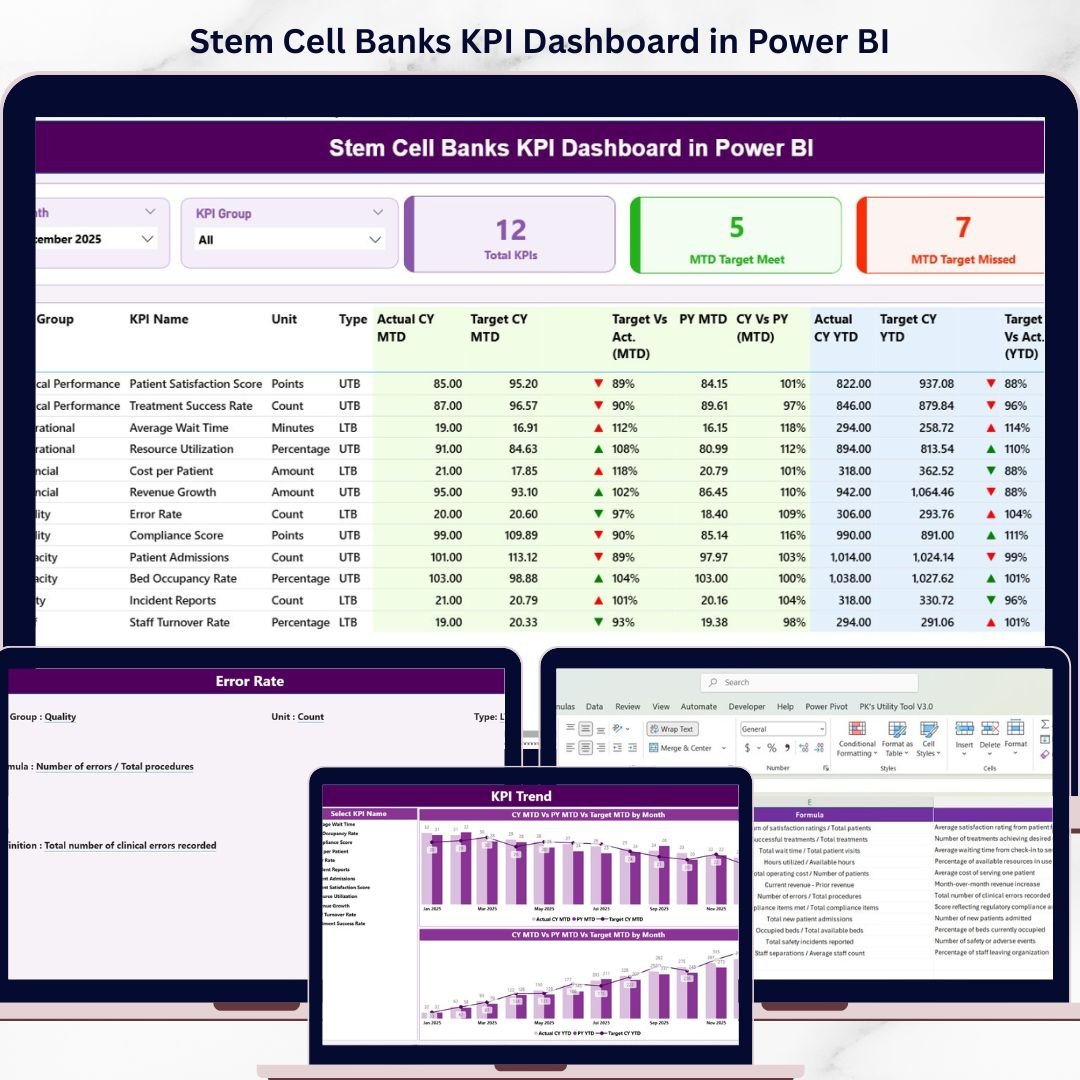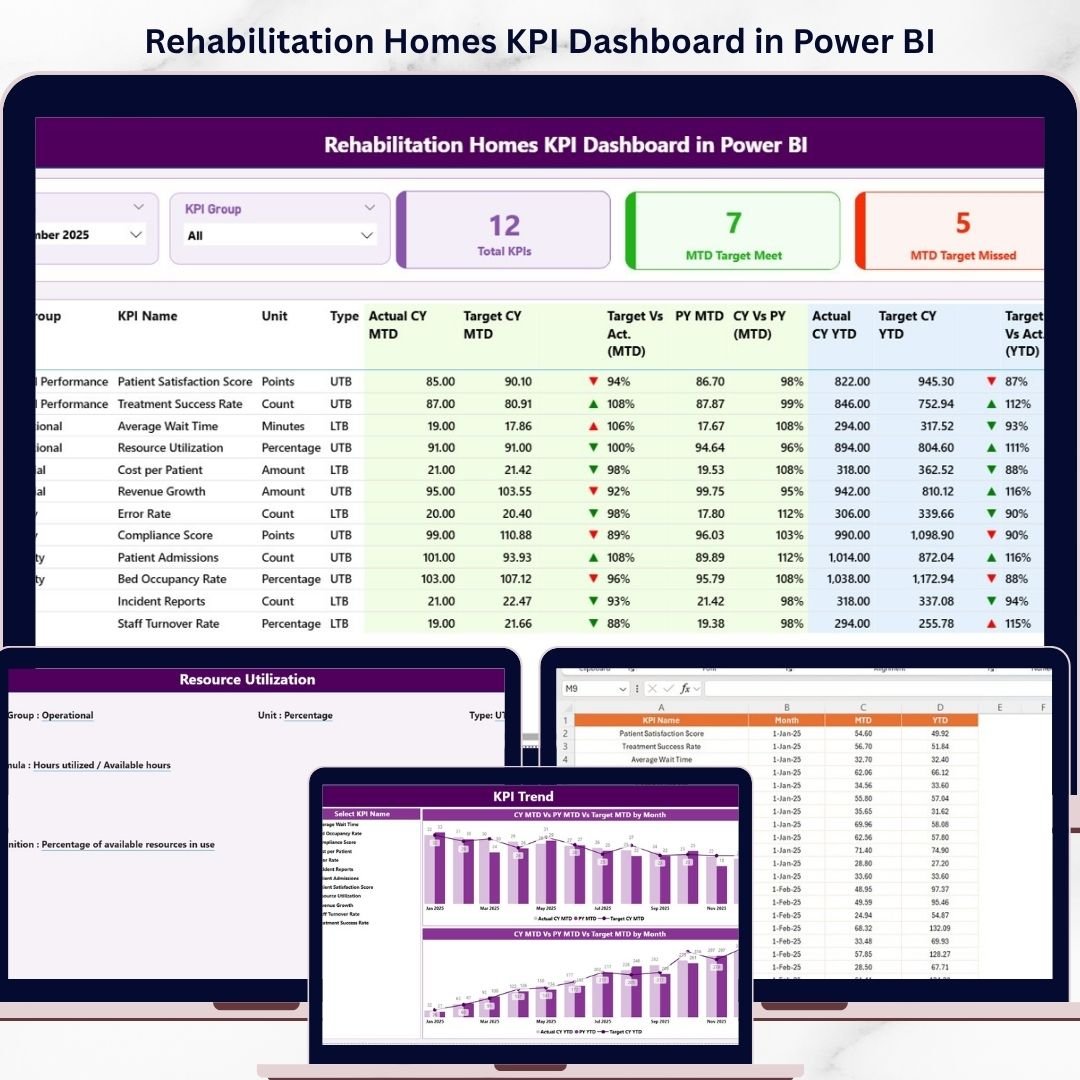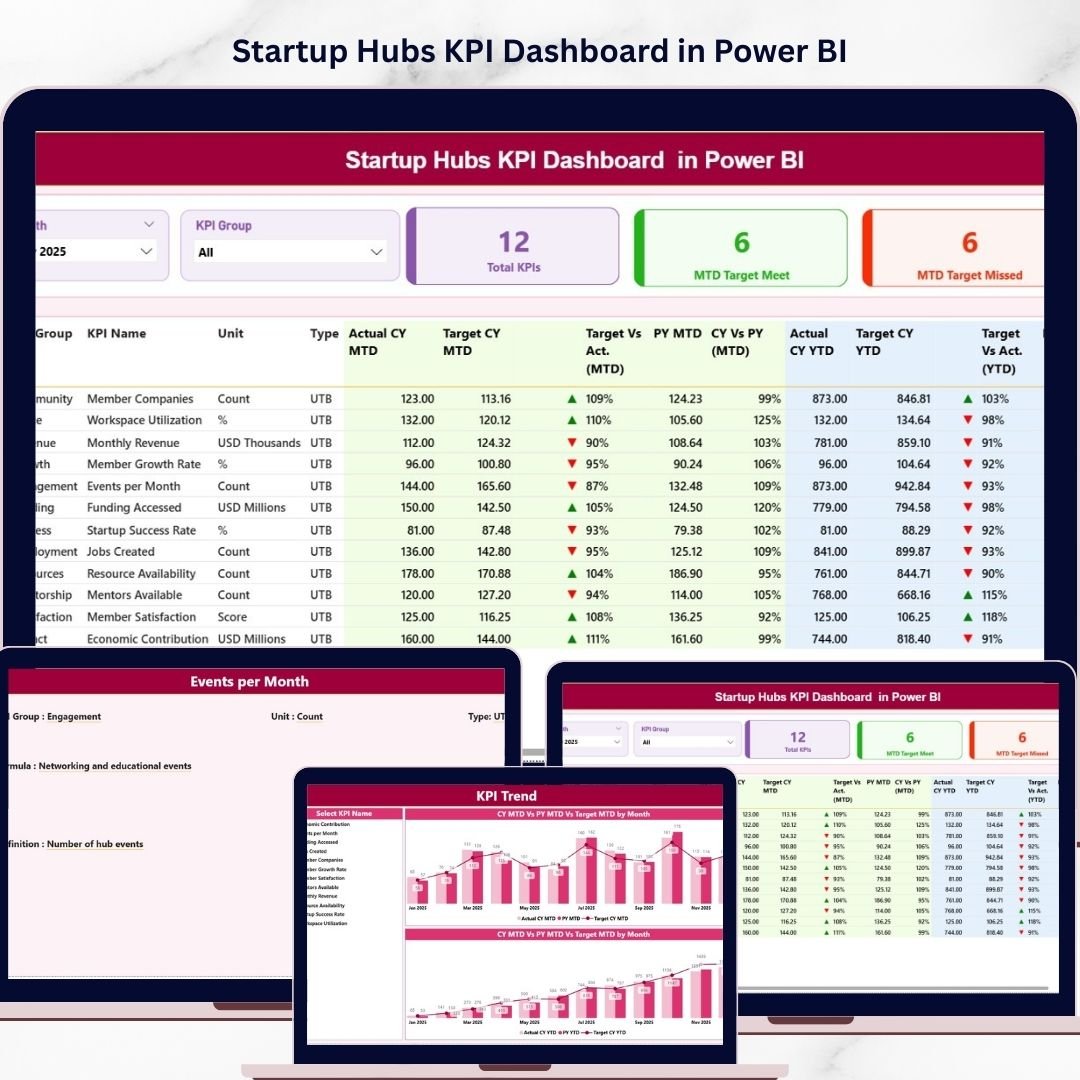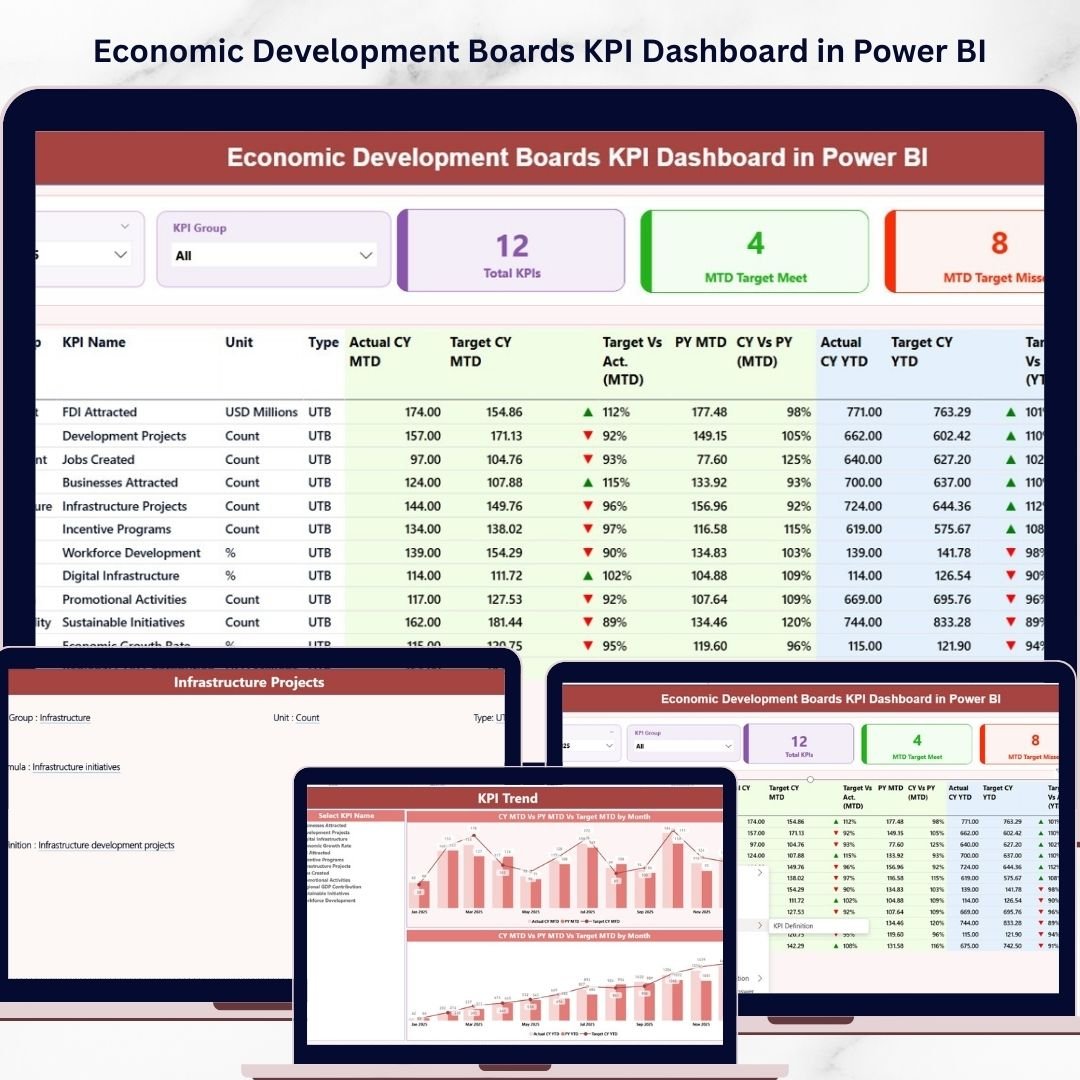
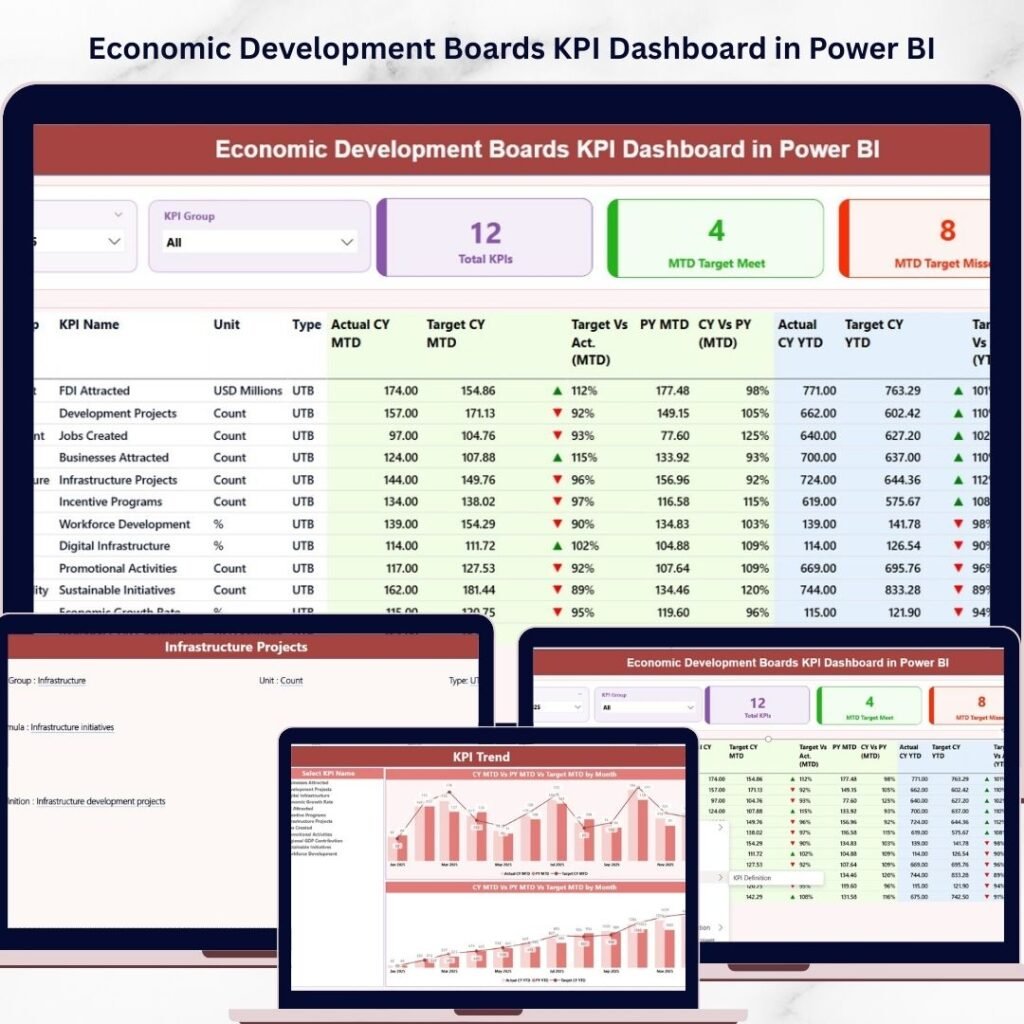
Economic development organizations handle a huge amount of performance data every month. They track investments, monitor job creation, evaluate infrastructure projects, and measure industrial growth. However, when this information stays scattered across spreadsheets and reports, decision-makers struggle to understand the real economic impact. The Economic Development Boards KPI Dashboard in Power BI solves this problem by transforming complex economic data into clear and interactive visual insights. This ready-to-use Power BI dashboard helps economic development agencies, government departments, and investment promotion boards monitor important economic indicators in one centralized system. Because the dashboard connects Excel data with Power BI analytics, organizations can instantly track KPIs, compare targets with actual results, analyze performance trends, and identify areas that require attention. As a result, leaders can make faster and more informed economic decisions. Whether you are monitoring investment inflow, job creation statistics, or export growth, this dashboard simplifies economic performance tracking through powerful visuals and interactive filters. �� Key Feature of Economic Development Boards KPI Dashboard in Power BI �� Interactive KPI MonitoringTrack multiple economic development KPIs in one centralized dashboard. �� Month & KPI Group SlicersFilter performance by month or by economic sector to analyze specific indicators. �� Powerful KPI CardsInstantly view high-level metrics including Total KPIs, Target Achieved, and Target Missed indicators. �� MTD & YTD Performance TrackingMonitor both Month-to-Date and Year-to-Date KPI performance. �� Target vs Actual AnalysisQuickly evaluate whether KPIs meet organizational targets. �� Previous Year ComparisonAnalyze year-over-year economic growth trends. �� Trend Analysis ChartsVisual combo charts show actual values, target values, and previous year comparisons. �� KPI Definition Drill-Through PageAccess detailed KPI definitions, formulas, units, and logic. ⚡ Automatic Data RefreshSimply update the Excel data file and refresh Power BI to update the dashboard. Economic Development Boards KPI Dashboard in Power BI �� What’s Inside the Economic Development Boards KPI Dashboard in Power BI This digital product includes a structured Power BI dashboard with three analytical pages designed for comprehensive economic performance monitoring. 1️⃣ Summary Page – Main KPI Dashboard The summary page provides a high-level view of economic performance. It includes interactive slicers for Month and KPI Group, allowing users to filter data quickly. The page also contains KPI cards displaying: Total KPIs Count MTD Target Meet Count MTD Target Missed Count Below the KPI cards, a detailed KPI table displays performance information including: KPI Number KPI Group KPI Name Measurement Unit KPI Type (LTB or UTB) Actual MTD & YTD values Target values Previous year comparisons Performance icons (green arrows and red arrows) visually indicate whether targets were achieved. 2️⃣ KPI Trend Page – Performance Visualization The KPI Trend page focuses on visual trend analysis. Users can select any KPI using the slicer on the left side. Two combo charts display: Current year performance Previous year performance Target values The charts analyze both MTD and YTD trends, allowing organizations to easily identify growth patterns or performance gaps. 3️⃣ KPI Definition Page – KPI Documentation This hidden drill-through page stores detailed KPI documentation. It includes: KPI formula KPI definition KPI measurement unit KPI category Calculation logic This ensures that all teams interpret KPIs consistently and maintain transparency in reporting. ⚙️ How to Use the Economic Development Boards KPI Dashboard in Power BI Using this dashboard is extremely simple. 1️⃣ Open the Power BI dashboard file provided in the download. 2️⃣ Update the Excel data source file which contains three worksheets: Input_Actual Sheet – Enter actual KPI values including MTD and YTD performance. Input_Target Sheet – Enter monthly and yearly KPI target values. KPI Definition Sheet – Store KPI metadata including KPI number, group, formula, and type. 3️⃣ After updating the Excel file, simply click Refresh in Power BI. 4️⃣ The dashboard visuals automatically update with the latest data. Within seconds, you will have a fully updated KPI dashboard showing performance insights. �� Who Can Benefit from This Economic Development Boards KPI Dashboard in Power BI This dashboard is ideal for organizations that monitor economic performance indicators. �� Economic Development Agencies – Track investment inflow, job creation, and economic initiatives. �� Government Departments – Monitor policy outcomes and infrastructure development projects. �� Investment Promotion Agencies – Analyze investment attraction and industrial expansion. �� Policy Analysts & Researchers – Study economic trends and development performance. �� City Development Authorities – Monitor urban development and regional growth initiatives. Because the dashboard simplifies complex economic data analysis, it becomes a powerful decision-making tool for public sector organizations. Click here to read the Detailed blog post Watch the step-by-step video tutorial: Visit our YouTube channel to learn step-by-step video tutorials �� YouTube Channel