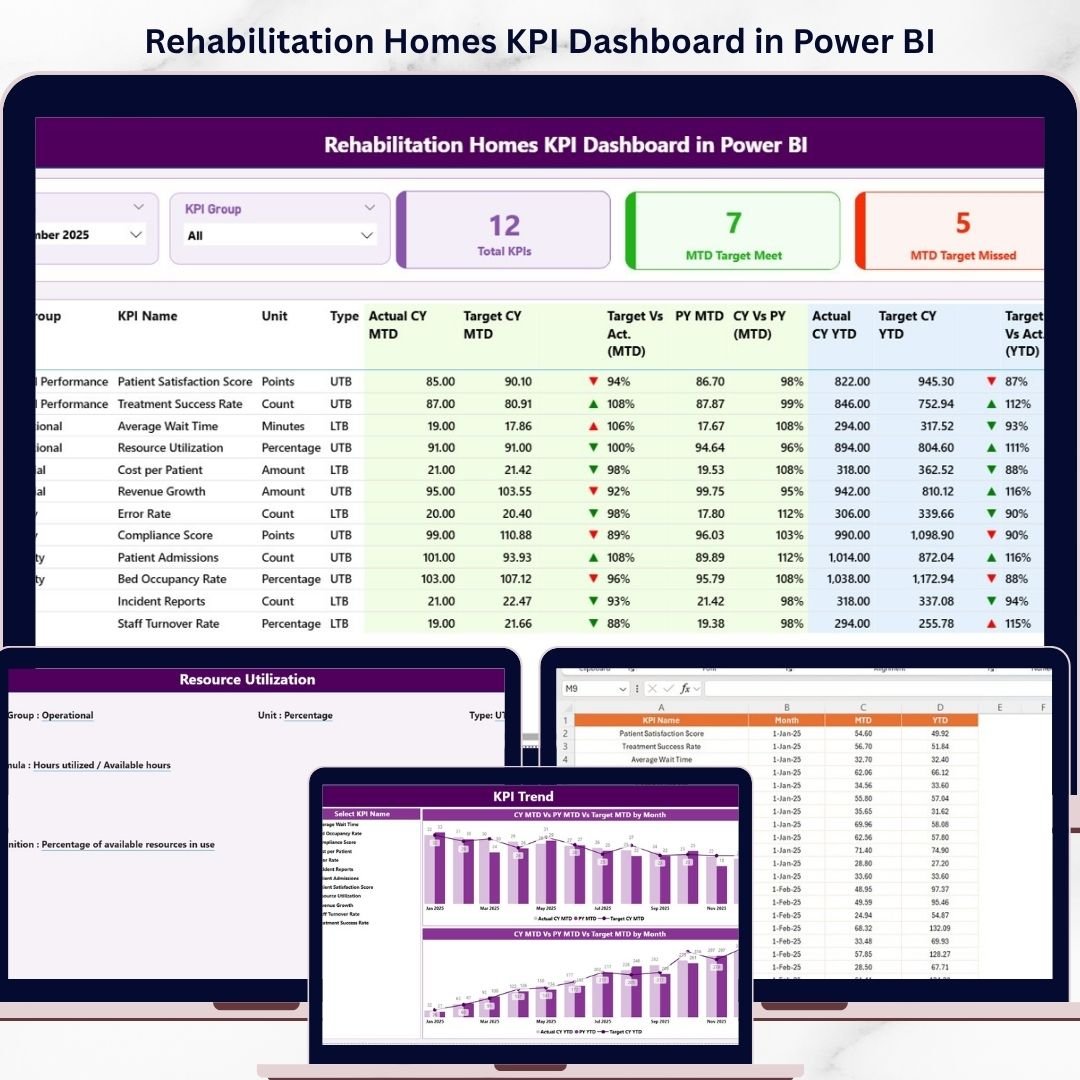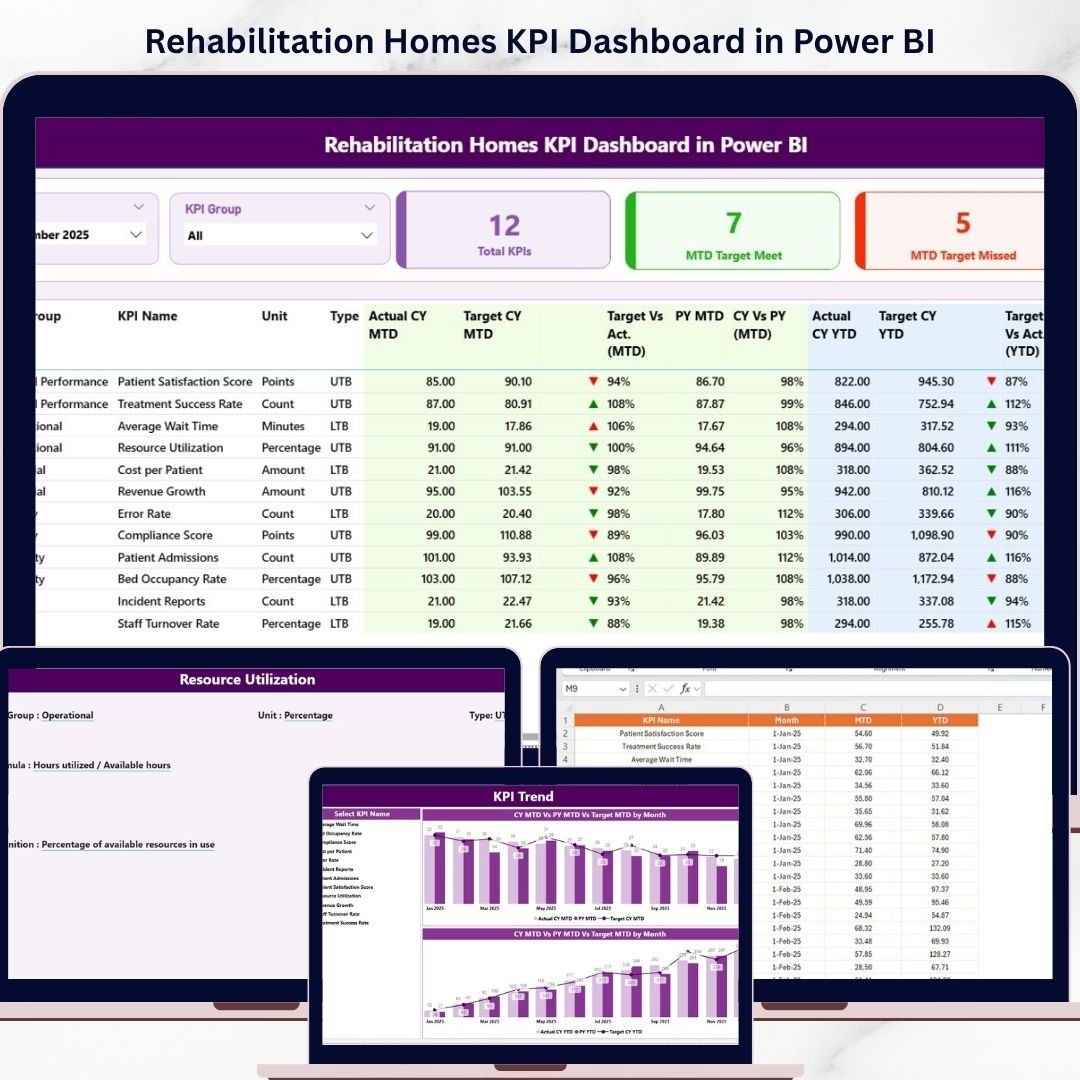
Managing a rehabilitation center requires continuous monitoring of patient recovery, operational efficiency, and financial performance. However, relying on manual reports and scattered data sources makes it difficult to track KPIs, analyze trends, and make timely decisions. Introducing the Rehabilitation Homes KPI Dashboard in Power BI – a dynamic, ready-to-use solution designed to help healthcare professionals monitor performance, compare targets, and improve patient outcomes effortlessly. This interactive dashboard transforms complex healthcare data into clear, actionable insights. It allows you to monitor Month-to-Date (MTD) and Year-to-Date (YTD) performance, compare actual vs target vs previous year, and instantly identify performance gaps using visual indicators. Whether you are focused on improving patient recovery, optimizing therapy performance, or enhancing operational efficiency, this dashboard gives you complete visibility and control over your rehabilitation center’s performance. �� Key Features of Rehabilitation Homes KPI Dashboard in Power BI �� Interactive KPI Dashboard – Track all KPIs in one centralized view�� Dynamic Slicers – Filter data by month and KPI group instantly�� MTD & YTD Analysis – Compare actual, target, and previous year values�� Visual Performance Indicators – Identify gaps using intuitive arrows�� KPI Trend Charts – Analyze performance trends over time�� KPI Definition Page – Understand formulas and KPI logic clearly⚡ Real-Time Data Updates – Refresh dashboard instantly from Excel source�� Automated Calculations – Reduce manual effort and improve accuracy �� What’s Inside the Rehabilitation Homes KPI Dashboard in Power BI This Power BI template includes 3 powerful and interactive pages: �� Summary Page – Complete overview of KPIs with slicers and KPI cards�� KPI Trend Page – Analyze trends with MTD and YTD comparison charts�� KPI Definition Page – View detailed KPI formulas, types, and definitions Additionally, the dashboard is connected to a structured Excel data source with input sheets for actual, target, and KPI definitions, ensuring easy data management. ⚙️ How to Use the Rehabilitation Homes KPI Dashboard in Power BI Getting started is simple and efficient: 1️⃣ Enter Data in Excel – Input actual and target KPI values2️⃣ Load Data into Power BI – Connect Excel file to the dashboard3️⃣ Refresh Dashboard – Update visuals instantly4️⃣ Use Slicers – Filter data by month or KPI group5️⃣ Analyze Insights – Identify trends and performance gaps �� Within minutes, you can turn rehabilitation data into actionable insights. �� Who Can Benefit from This Rehabilitation Homes KPI Dashboard in Power BI This dashboard is ideal for healthcare professionals: �� Rehabilitation Center Administrators – Monitor overall performance��⚕️ Healthcare Managers – Improve patient recovery outcomes�� Data Analysts – Perform KPI and trend analysis�� Finance Teams – Track cost efficiency and performance�� Healthcare Consultants – Provide data-driven insights �� In short, anyone involved in healthcare performance tracking will benefit from this tool. With its intuitive design, real-time insights, and powerful analytics, this dashboard helps you improve decision-making, enhance patient care, and optimize operations. Stop relying on manual reports and disconnected systems. �� Download now and take control of your rehabilitation KPIs with confidence! �� �� Click here to read the Detailed blog post �� Visit our YouTube channel to learn step-by-step video tutorials �� https://www.youtube.com/@PKAnExcelExpert