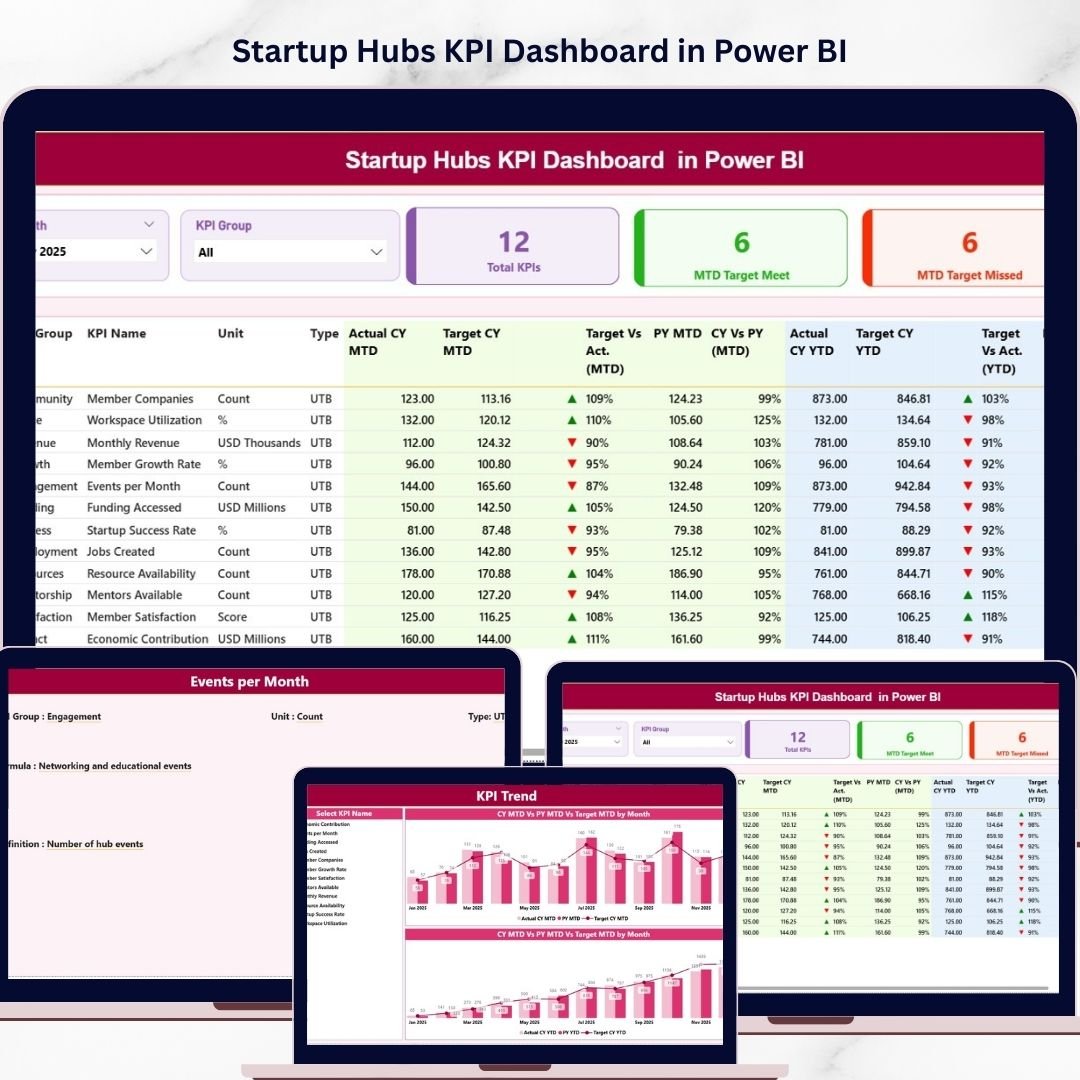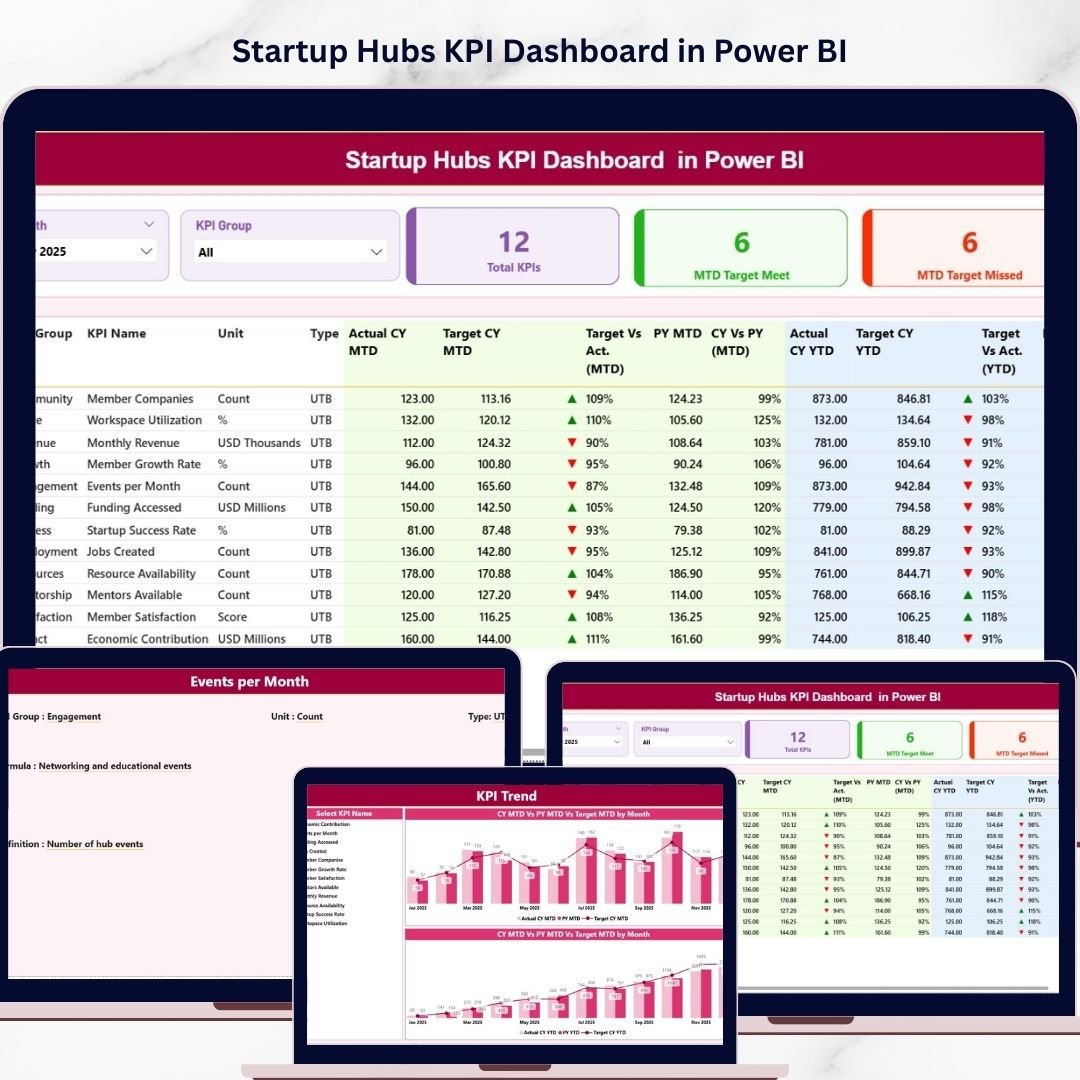
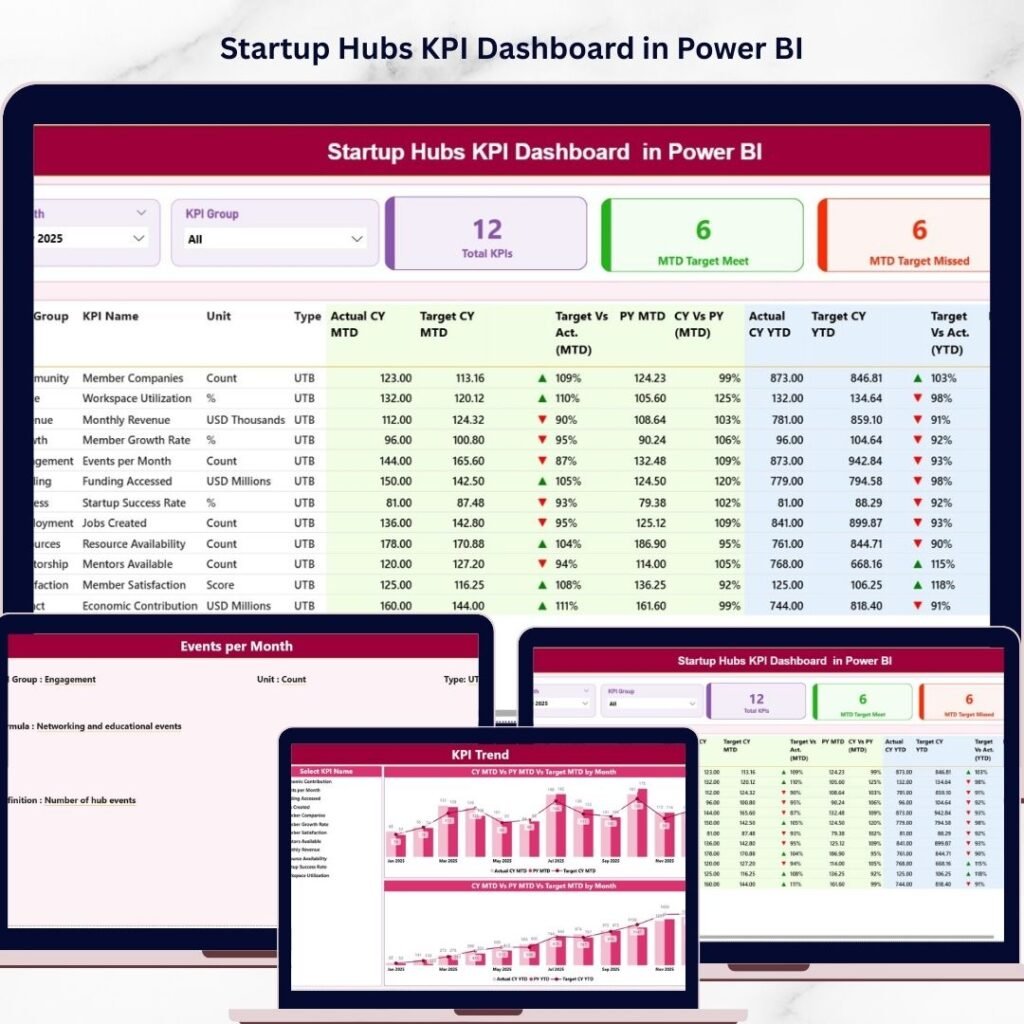
Managing startup ecosystems requires strong visibility into performance, funding activity, incubation success, and startup growth. Governments, incubators, venture capital firms, and innovation hubs constantly work with startups to accelerate innovation and entrepreneurship. However, tracking the performance of startup programs manually through scattered spreadsheets and reports can quickly become overwhelming. This is where the Startup Hubs KPI Dashboard in Power BI becomes a powerful solution. This ready-to-use analytics dashboard helps startup ecosystem managers monitor key performance indicators (KPIs) in a centralized and interactive reporting environment. The dashboard consolidates important metrics such as startup growth, funding progress, incubation program success, investor engagement, and operational efficiency. Because it runs on Microsoft Power BI, users can explore data using dynamic charts, filters, slicers, and KPI cards. With this dashboard, startup hub managers can instantly analyze performance, track progress toward targets, and identify growth opportunities. Instead of spending hours compiling reports, decision-makers can quickly understand ecosystem performance and make data-driven decisions. �� Key Feature of Startup Hubs KPI Dashboard in Power BI The Startup Hubs KPI Dashboard in Power BI includes three powerful analytical pages that provide deep insights into startup ecosystem performance. �� Interactive Summary DashboardMonitor overall startup hub performance using dynamic KPI cards, detailed KPI tables, and performance indicators. �� Month and KPI Group FiltersEasily analyze performance by selecting specific months or KPI categories using slicers. �� Target vs Actual KPI TrackingCompare actual performance with targets using automatic calculations and visual indicators. �� MTD and YTD Performance AnalysisTrack both Month-To-Date and Year-To-Date performance to monitor short-term and long-term progress. �� Visual Performance IndicatorsQuickly identify KPI success using green arrows for achieved targets and red arrows for missed targets. �� KPI Trend Analysis PageAnalyze performance trends over time using powerful combo charts comparing actual values, targets, and previous year results. �� KPI Definition PageAccess detailed KPI documentation including KPI formulas, definitions, units, and KPI type classification. �� Excel Data IntegrationThe dashboard connects with Excel files, making it easy to update data and refresh reports regularly. �� What’s Inside the Startup Hubs KPI Dashboard in Power BI This ready-to-use Power BI template includes several important components that make startup ecosystem monitoring easier. ✔ 3 Power BI Report Pages 1️⃣ Summary Page – Displays overall KPI performance with KPI cards, performance tables, and visual indicators. Startup Hubs KPI Dashboard in Power BI 2️⃣ KPI Trend Page – Shows performance comparisons between current year, previous year, and target values using interactive charts. 3️⃣ KPI Definition Page – Provides complete KPI documentation with KPI formulas and definitions. ✔ Excel Data Source File The dashboard connects to an Excel workbook that includes three structured worksheets: �� Input Actual Sheet – Stores actual KPI values such as MTD and YTD performance.�� Input Target Sheet – Contains KPI target values for comparison.�� KPI Definition Sheet – Includes KPI metadata such as KPI group, formula, and KPI type. Because of this structured design, updating the dashboard becomes extremely simple. ⚙️ How to Use the Startup Hubs KPI Dashboard in Power BI Using this dashboard is simple and requires only a few steps. 1️⃣ Enter KPI Data in ExcelInput the actual KPI values and target values in the Excel data source file. 2️⃣ Refresh the Power BI DashboardOpen the Power BI file and refresh the dataset to update all charts and KPI indicators. 3️⃣ Analyze Dashboard PerformanceUse slicers to filter KPIs by month or KPI category. 4️⃣ Explore Trend AnalysisSelect a KPI on the KPI Trend Page to analyze historical performance trends. 5️⃣ View KPI DefinitionsDrill through to the KPI Definition page to understand the formulas and definitions behind each KPI. With this workflow, startup ecosystem managers can analyze performance within seconds. �� Who Can Benefit from This Startup Hubs KPI Dashboard in Power BI This dashboard is designed for organizations involved in startup ecosystem development. �� Startup Incubators – Monitor incubation program success and startup growth.�� Startup Accelerators – Track startup progress, funding milestones, and program outcomes.�� Innovation Hubs – Measure ecosystem performance and collaboration impact.�� Government Startup Programs – Evaluate national startup development initiatives.�� Venture Capital Firms – Analyze startup performance and investment progress. By using this dashboard, organizations gain better visibility into ecosystem performance and make smarter strategic decisions. ## Click here to read the Detailed blog post Visit our YouTube channel to learn step-by-step video tutorialshttps://youtube.com/@PKAnExcelExpert Watch the step-by-step video tutorial: