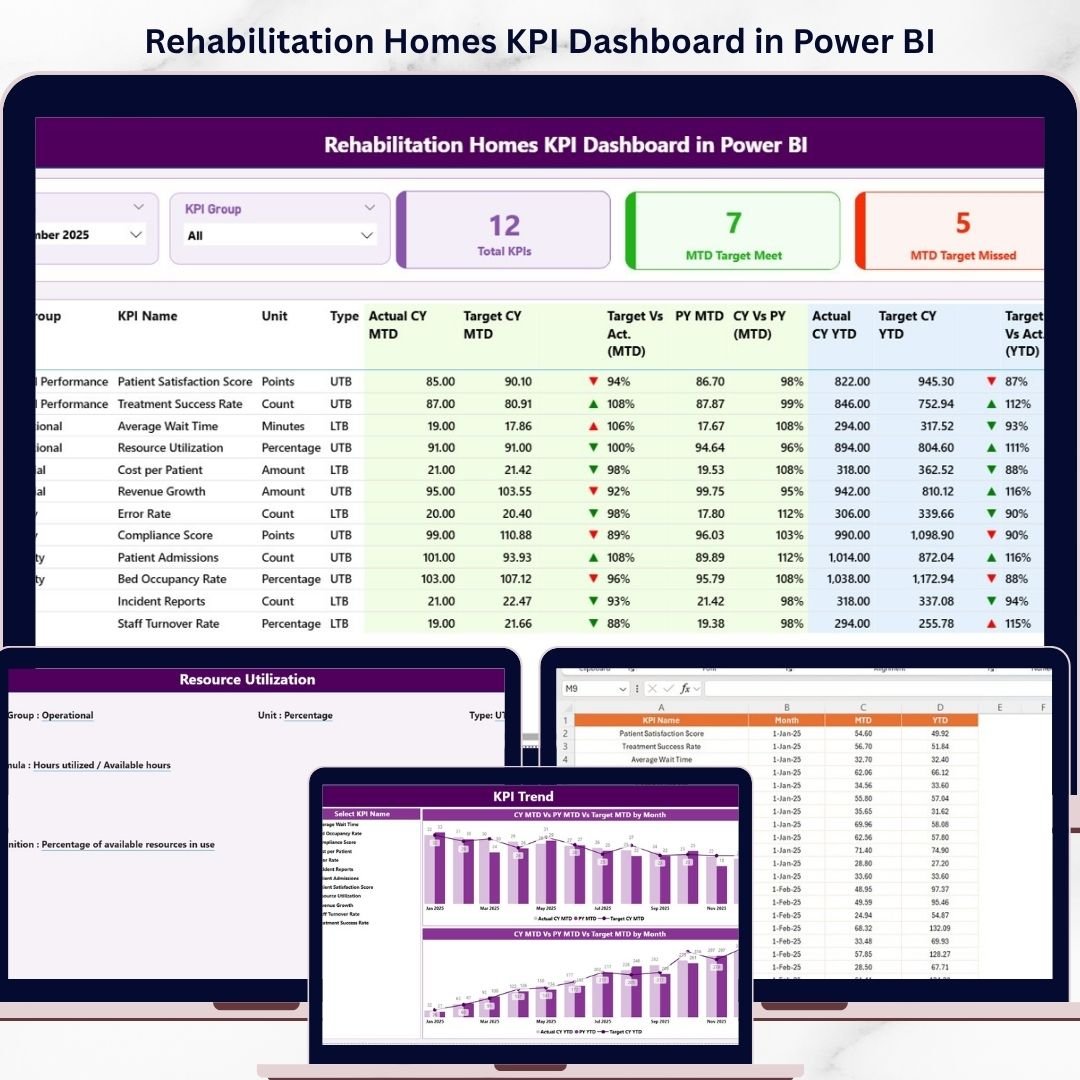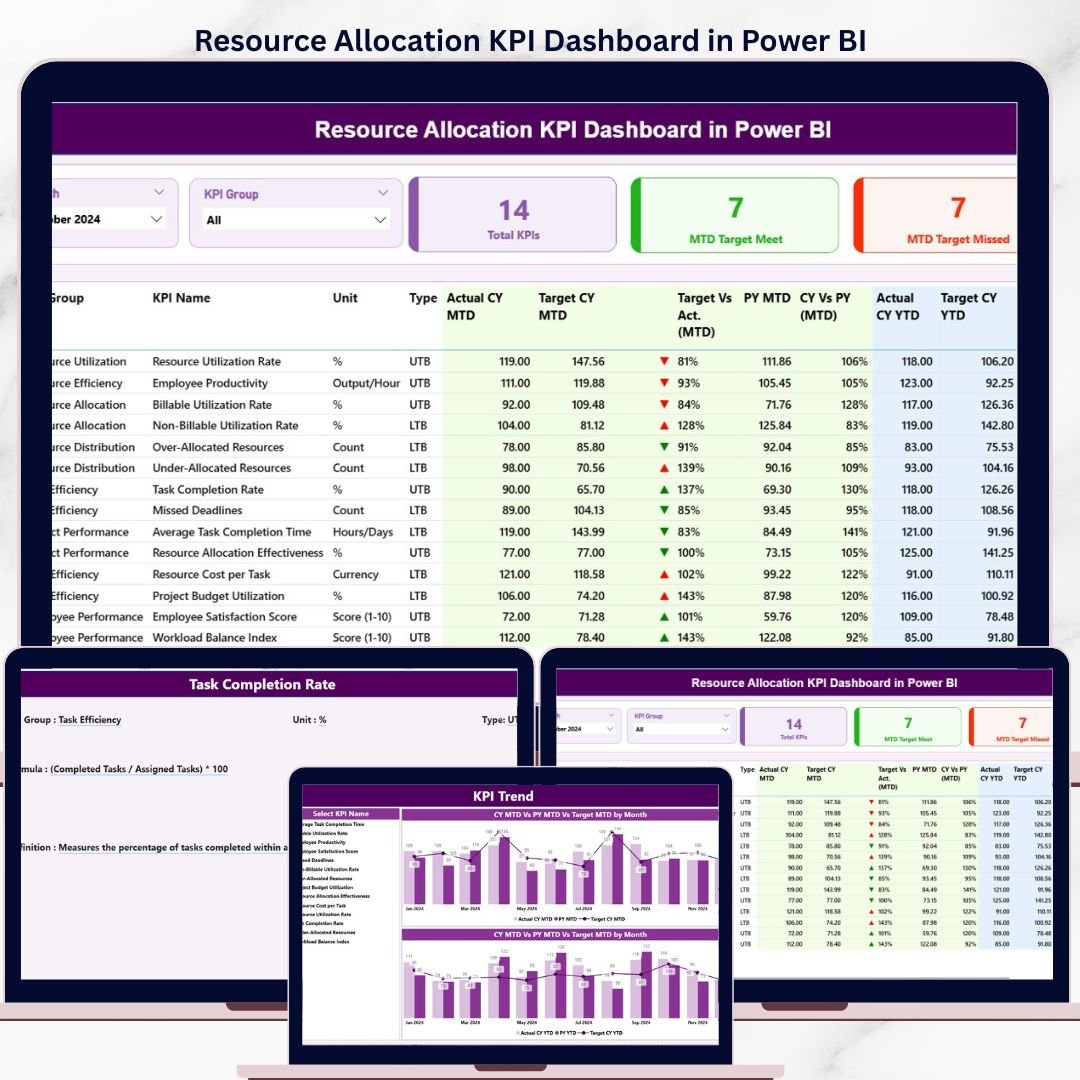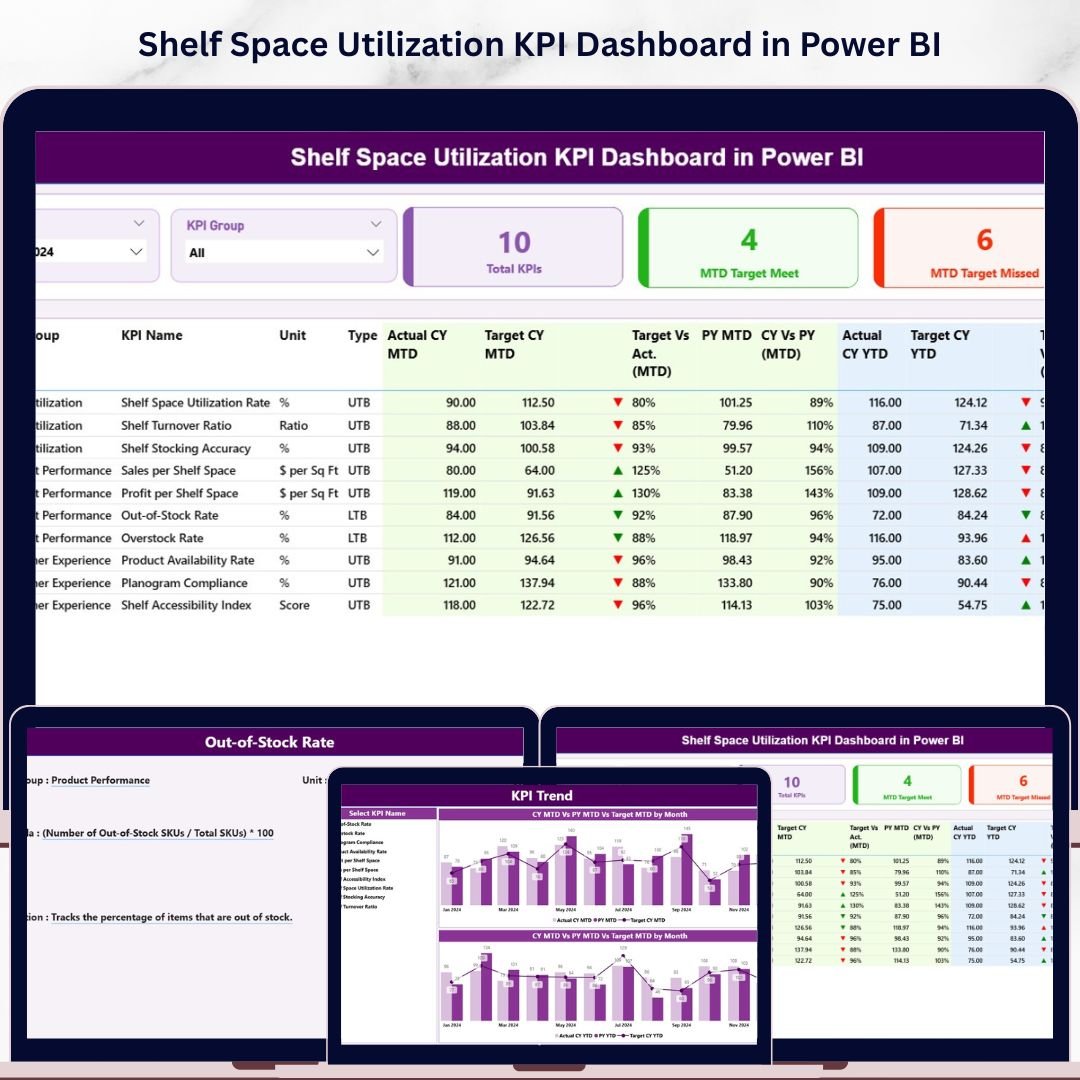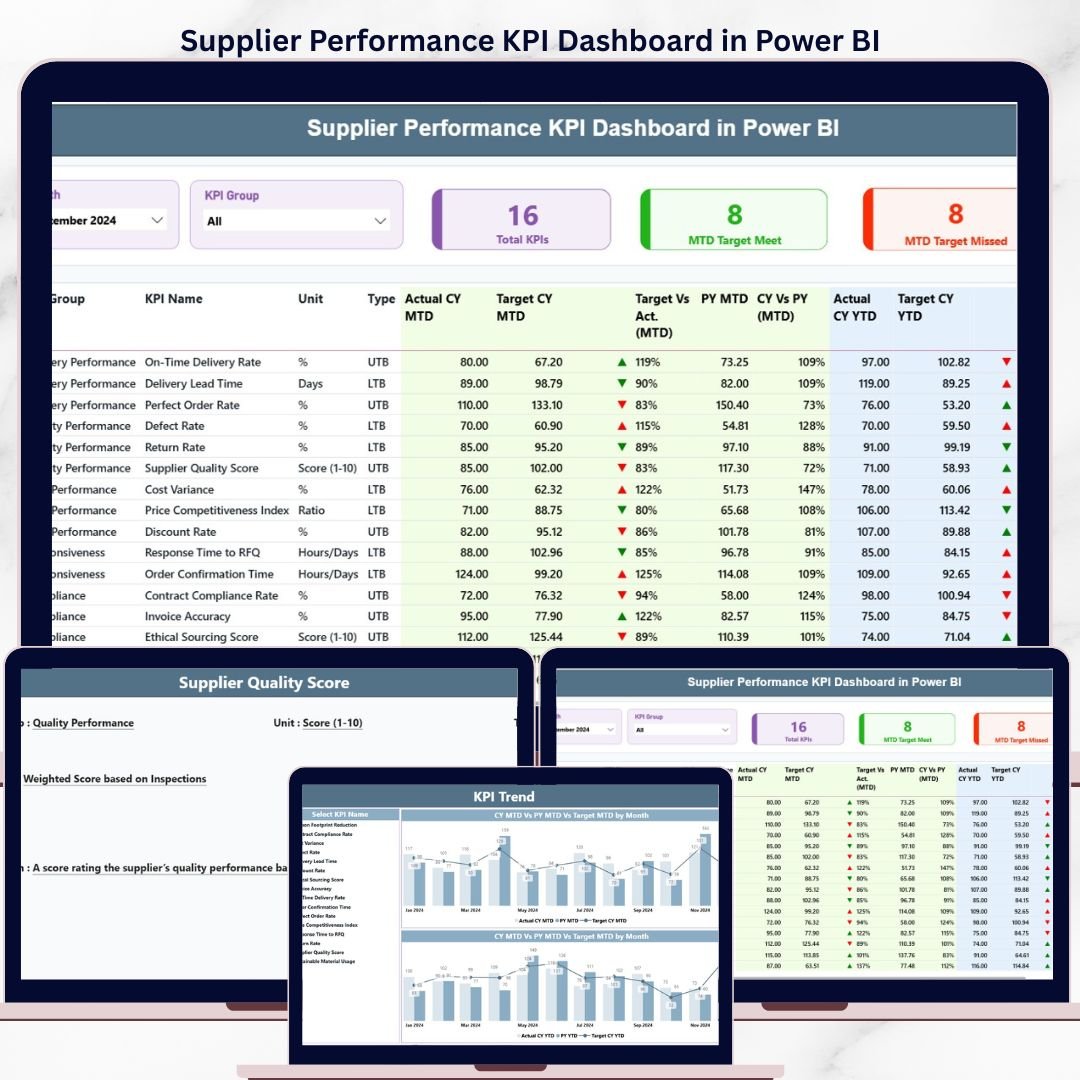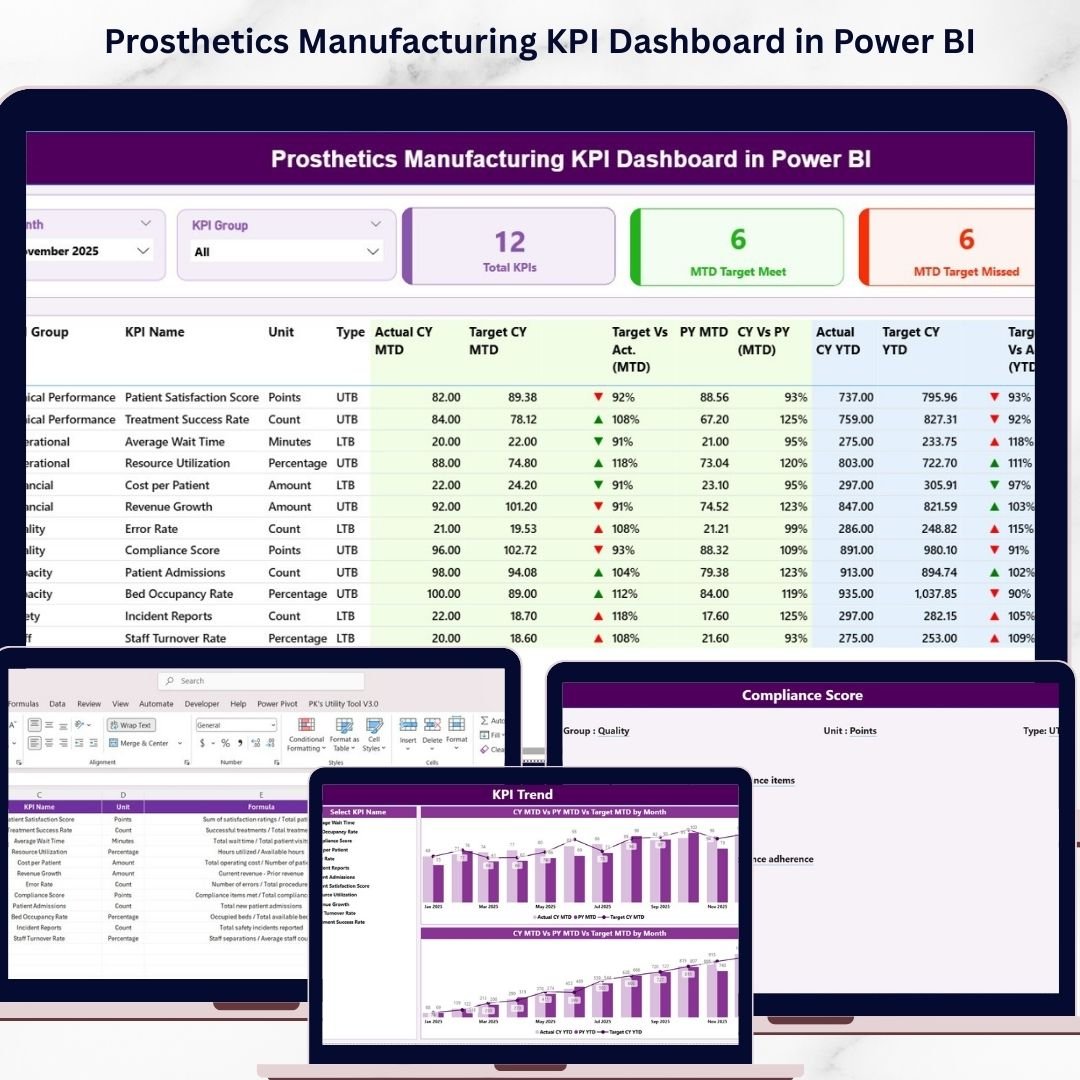
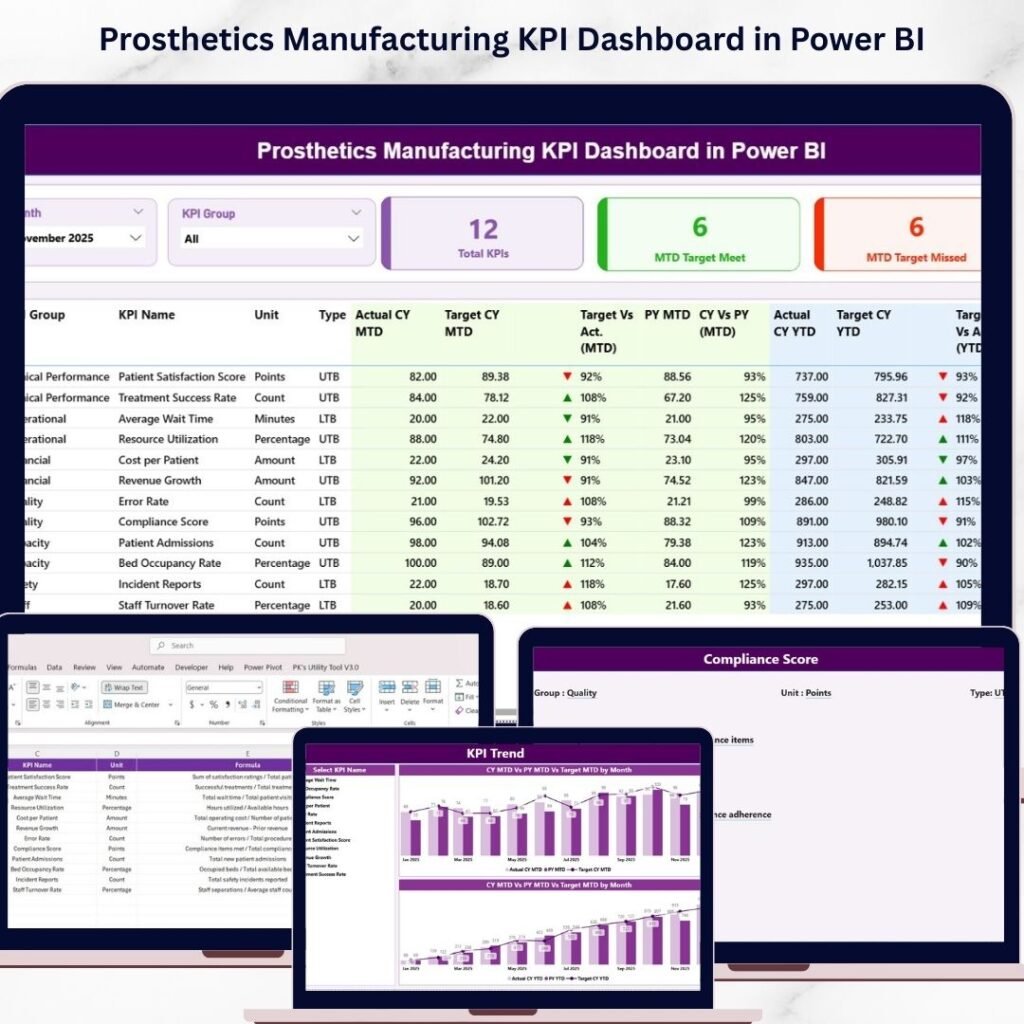
In prosthetics manufacturing, precision is not optional—it’s critical. Every product directly impacts a patient’s quality of life. But how do you ensure consistent performance, maintain quality standards, and optimize production efficiency—all at the same time? �� The answer lies in data-driven decision-making. Introducing the Prosthetics Manufacturing KPI Dashboard in Power BI — a powerful, interactive, and ready-to-use analytics solution designed to help manufacturers monitor performance, improve quality, and streamline operations effortlessly. �� This dashboard transforms complex production data into easy-to-understand visual insights. Instead of relying on scattered spreadsheets or outdated reports, you get a centralized system that gives you real-time control over your manufacturing operations. Whether you want to track production output, monitor defect rates, or analyze delivery performance, this dashboard provides everything in one place. Prosthetics Manufacturing KPI Dashboard in Power BI �� Key Features of Prosthetics Manufacturing KPI Dashboard in Power BI �� Centralized KPI Dashboard – Monitor all production metrics in a single interactive view.�� Dynamic Filters & Slicers – Analyze data by month and KPI groups instantly.�� Target vs Actual Tracking – Quickly identify performance gaps and improvement areas.�� MTD & YTD Analysis – Measure both short-term and long-term performance.�� Performance Indicators – Visual arrows highlight achievements and issues instantly.�� Previous Year Comparison – Evaluate growth trends and performance consistency.�� KPI Trend Analysis Page – Visualize patterns using dynamic combo charts.�� Drill-Through KPI Details – Access formulas, definitions, and KPI logic instantly.⚡ Real-Time Data Updates – Refresh Excel data and see results in seconds. �� What’s Inside the Prosthetics Manufacturing KPI Dashboard in Power BI This advanced dashboard includes 3 powerful pages designed for complete manufacturing analysis: �� Summary PageA comprehensive overview showing KPI cards, performance indicators, and a detailed KPI table with MTD and YTD comparisons. �� KPI Trend PageAnalyze performance trends with interactive charts comparing current year, previous year, and target values. �� KPI Definition PageA drill-through page that provides detailed KPI documentation including formulas, units, and definitions. The dashboard is supported by structured Excel data sources: �� Input_Actual Sheet – Stores actual MTD and YTD production data�� Input_Target Sheet – Contains production targets�� KPI Definition Sheet – Defines all KPIs and their logic Together, these components create a complete performance management system for your manufacturing unit. ⚙️ How to Use the Prosthetics Manufacturing KPI Dashboard in Power BI You don’t need advanced technical skills to use this dashboard. �� Step 1: Define KPIsEnter KPI names, formulas, and units in the KPI Definition sheet. �� Step 2: Set TargetsInput monthly and yearly targets in the Target sheet. �� Step 3: Add Actual DataUpdate production data in the Actual sheet. �� Step 4: Refresh Power BI DashboardLoad updated data into Power BI for instant visualization. �� Step 5: Analyze InsightsUse filters, slicers, and charts to monitor trends and performance. Within minutes, you’ll gain full visibility into your production operations. �� Who Can Benefit from This Prosthetics Manufacturing KPI Dashboard in Power BI �� Prosthetics Manufacturers – Monitor production efficiency and quality control.�� Operations Managers – Identify bottlenecks and improve workflows.���� Plant Managers – Track output, performance, and delivery timelines.�� Business Owners – Optimize productivity and profitability.�� Quality Control Teams – Monitor defect rates and compliance metrics.�� Supply Chain Managers – Improve delivery performance and coordination. If your goal is to enhance production efficiency, reduce errors, and improve product quality—this dashboard is your ultimate solution. This dashboard is not just a reporting tool—it’s a complete manufacturing intelligence system. It helps you uncover inefficiencies, improve quality, and take faster action. �� Stop relying on outdated reports.�� Start managing your manufacturing performance with real-time insights. �� Click here to read the Detailed blog post �� Visit our YouTube channel to learn step-by-step video tutorials �� https://www.youtube.com/@PKAnExcelExpert