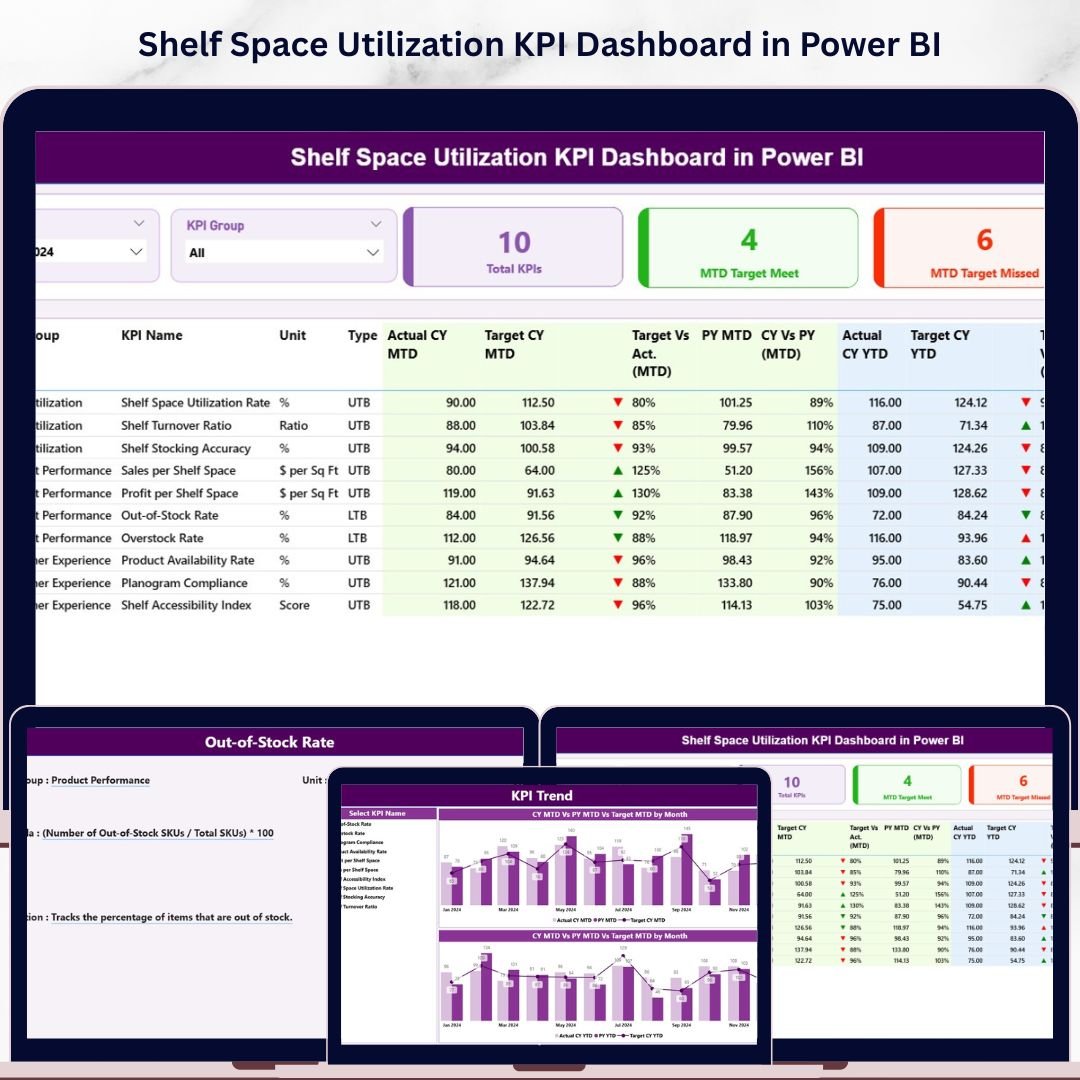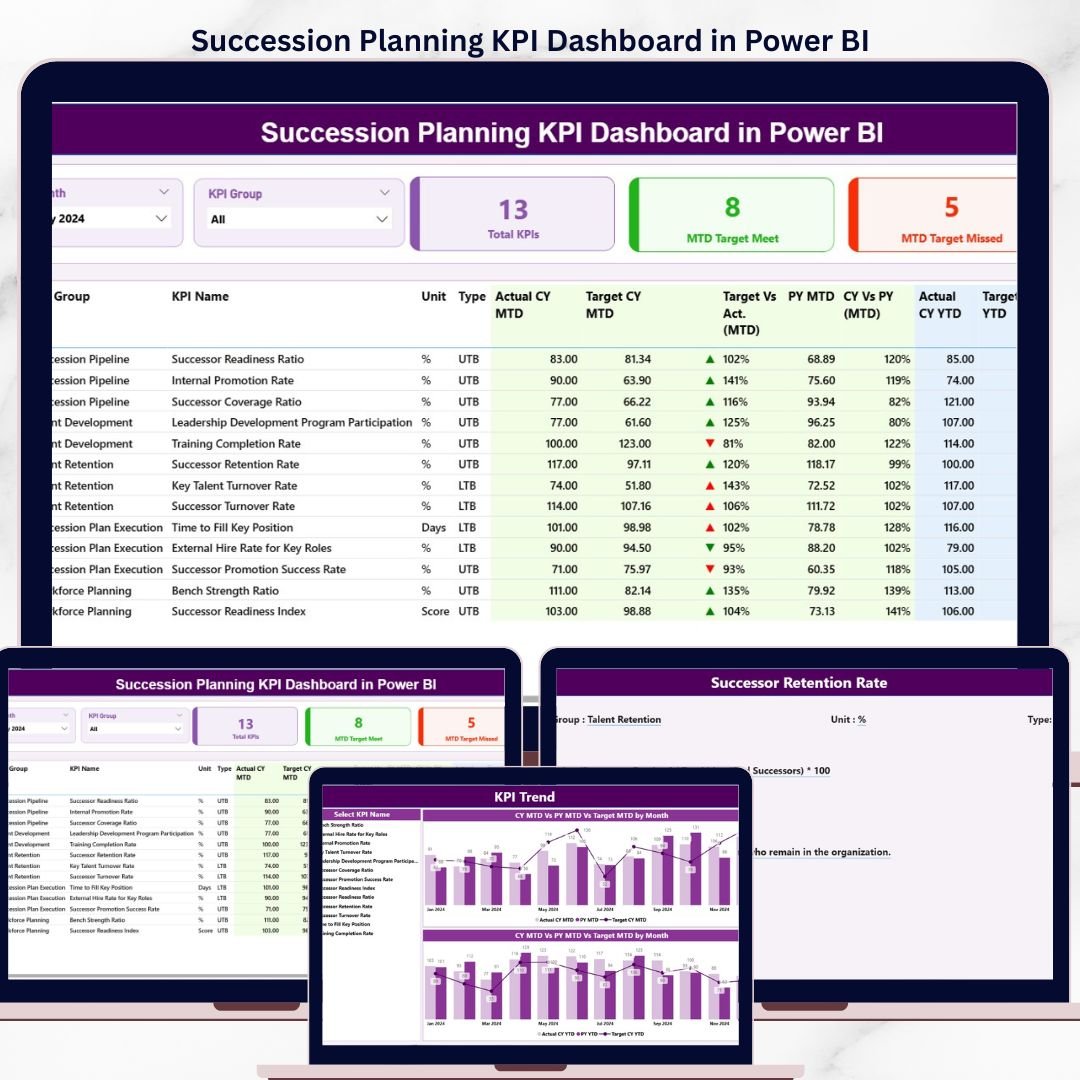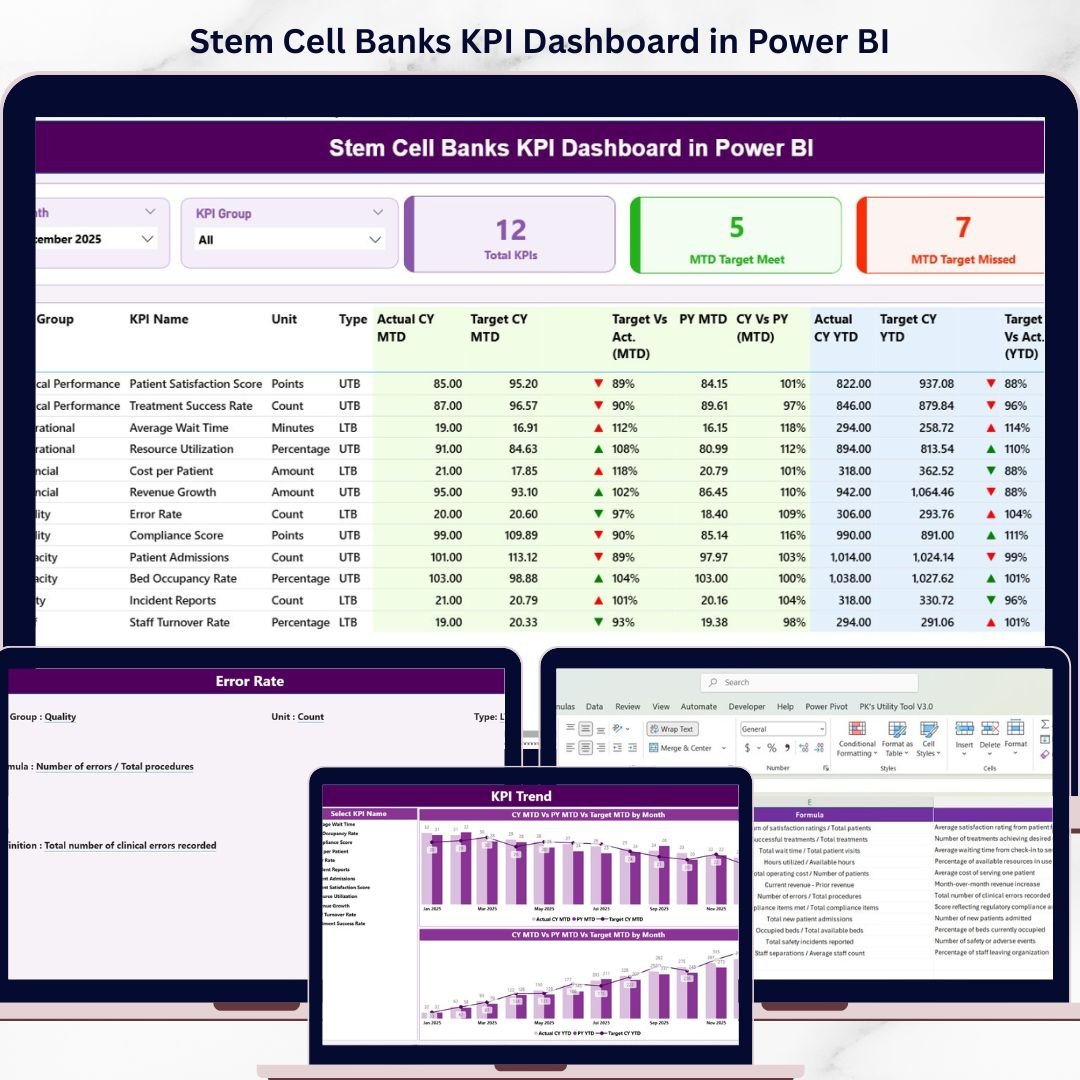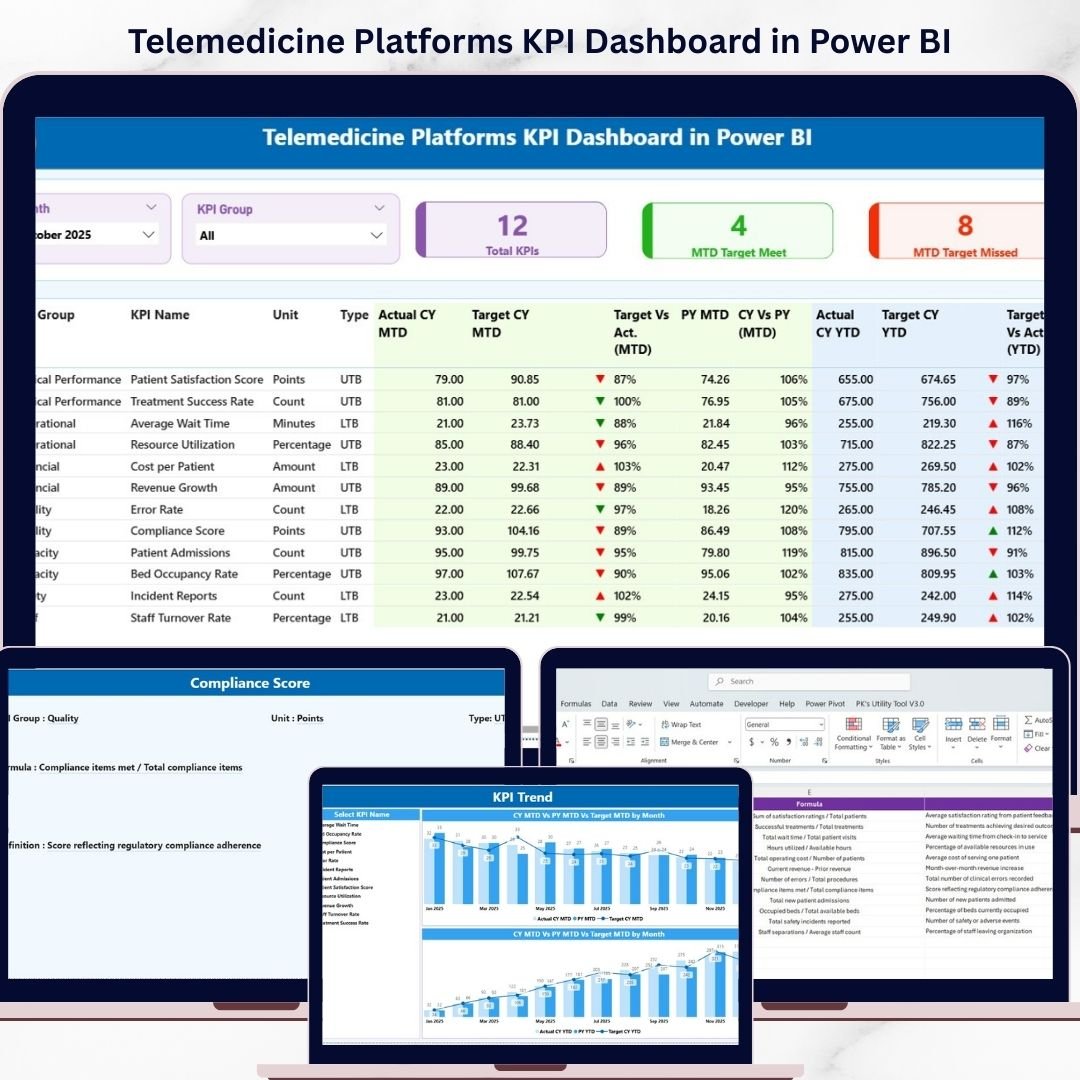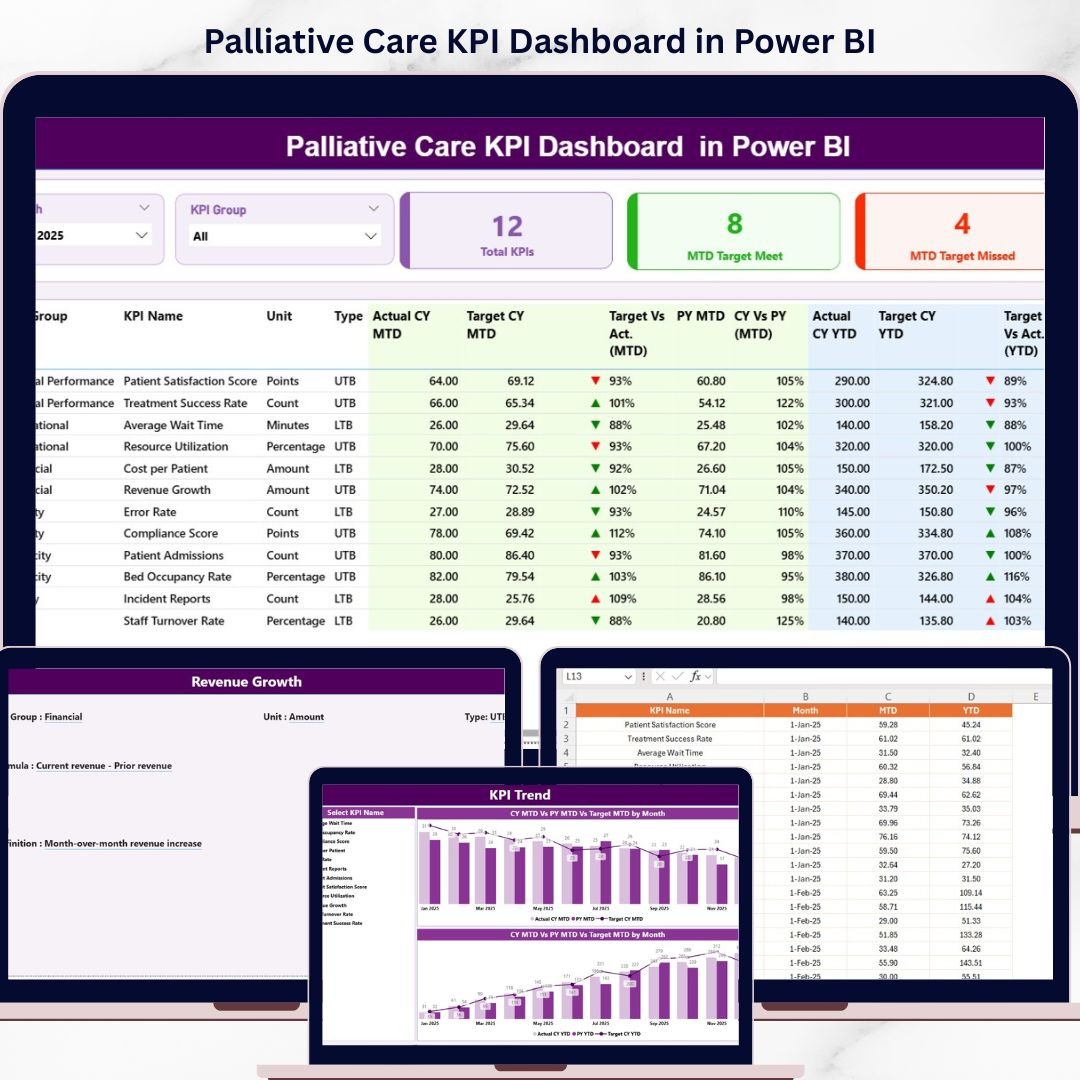
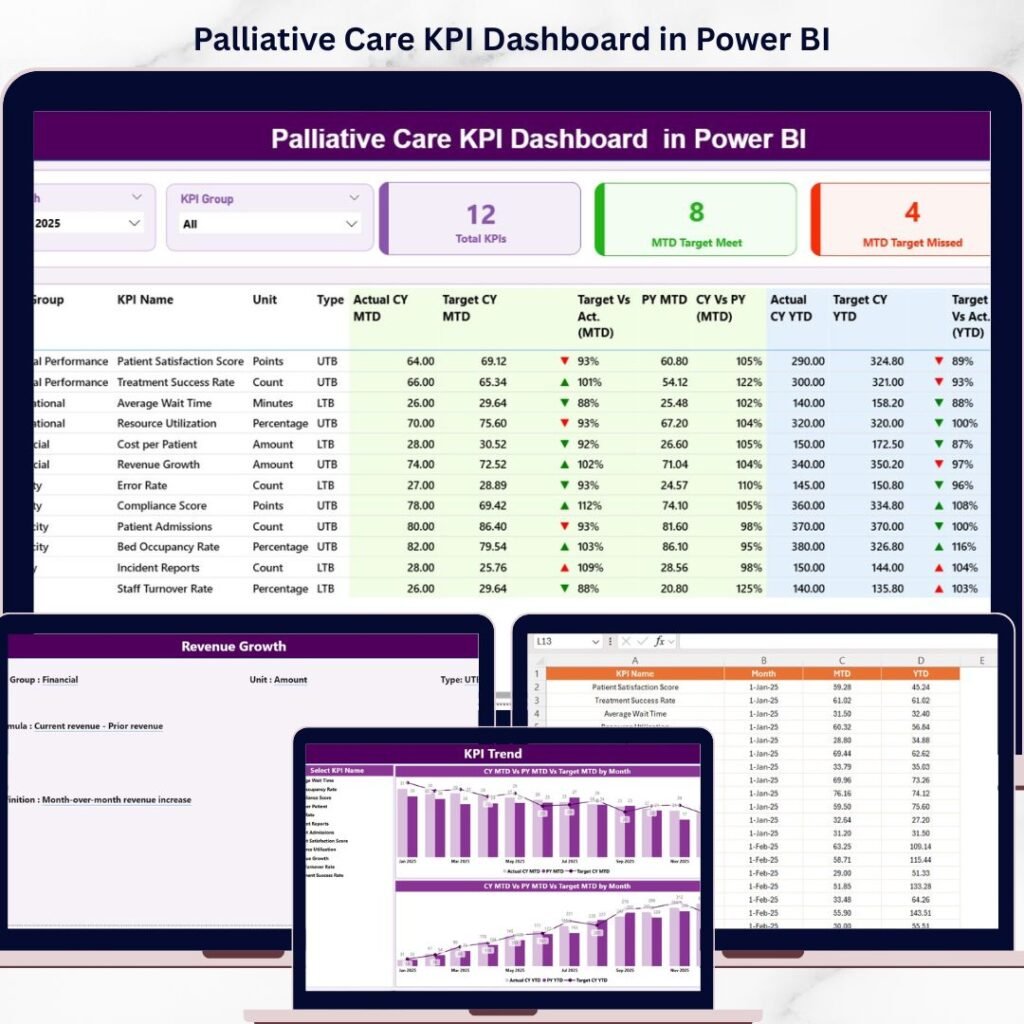
Are you struggling to monitor palliative care performance across multiple systems? Finding it difficult to track patient outcomes, service quality, and healthcare KPIs efficiently? – Palliative Care KPI Dashboard in Power BI! This powerful, ready-to-use Power BI dashboard is designed specifically for hospitals, healthcare providers, and palliative care teams who want to deliver better patient care through data-driven insights. Instead of relying on scattered data and manual reports, this dashboard centralizes all your key performance indicators into one interactive and visually rich platform. With real-time analytics, automated calculations, and dynamic visuals, you can instantly monitor performance, compare targets, and identify trends. As a result, you can make faster decisions, improve patient outcomes, and enhance operational efficiency. Palliative Care KPI Dashboard in Power BI �� Key Features of Palliative Care KPI Dashboard in Power BI ✨ �� Real-Time KPI Monitoring – Track patient care performance instantly with dynamic visuals. ✨ �� Target vs Actual Comparison – Compare actual performance against targets using MTD and YTD metrics. ✨ �� KPI Trend Analysis – Analyze performance trends over time and compare with previous year data. ✨ �� Detailed KPI Table – Access KPI details including type, unit, and performance indicators. ✨ ��️ Interactive Slicers – Filter data by Month and KPI Group for deeper analysis. ✨ �� KPI Definition Page – Understand KPI formulas and definitions with a drill-through feature. ✨ ⚡ Automated Reporting – Eliminate manual work with auto-updating dashboards. �� What’s Inside the Palliative Care KPI Dashboard in Power BI �� Summary Page – Central dashboard displaying KPI cards, slicers, and detailed KPI performance table. �� KPI Trend Page – Combo charts showing Actual vs Target vs Previous Year for MTD and YTD analysis. �� KPI Definition Page – Drill-through page explaining KPI logic, formulas, and definitions. �� Excel Data Source Files – Structured sheets for Actual, Target, and KPI Definitions. �� Dynamic Power BI Visuals – Fully automated charts and indicators for real-time insights. ��️ How to Use the Palliative Care KPI Dashboard in Power BI �� Step 1: Enter KPI data into Excel input sheets (Actual & Target)�� Step 2: Define KPIs clearly in the KPI Definition sheet�� Step 3: Load or refresh data in Power BI�� Step 4: Use slicers to filter KPIs by Month or Group�� Step 5: Analyze trends, performance, and patient care insights �� No advanced Power BI skills required—simple, efficient, and powerful! �� Who Can Benefit from This Palliative Care KPI Dashboard in Power BI ✔️ Hospitals & Healthcare Centers – Monitor palliative care performance effectively✔️ Palliative Care Teams – Improve patient care quality and outcomes✔️ Healthcare Analysts – Analyze data and generate insights✔️ Administrators – Enhance operational efficiency and reporting✔️ Policy Makers – Track healthcare performance and improve strategies This dashboard is more than just a reporting tool—it’s a complete healthcare performance management solution. It helps you identify care gaps, track improvements, and ensure high-quality services for patients. If you want to improve patient outcomes, enhance efficiency, and make smarter healthcare decisions, this dashboard is the perfect solution. �� Click here to read the Detailed blog post �� Visit our YouTube channel to learn step-by-step video tutorials �� YouTube Channel