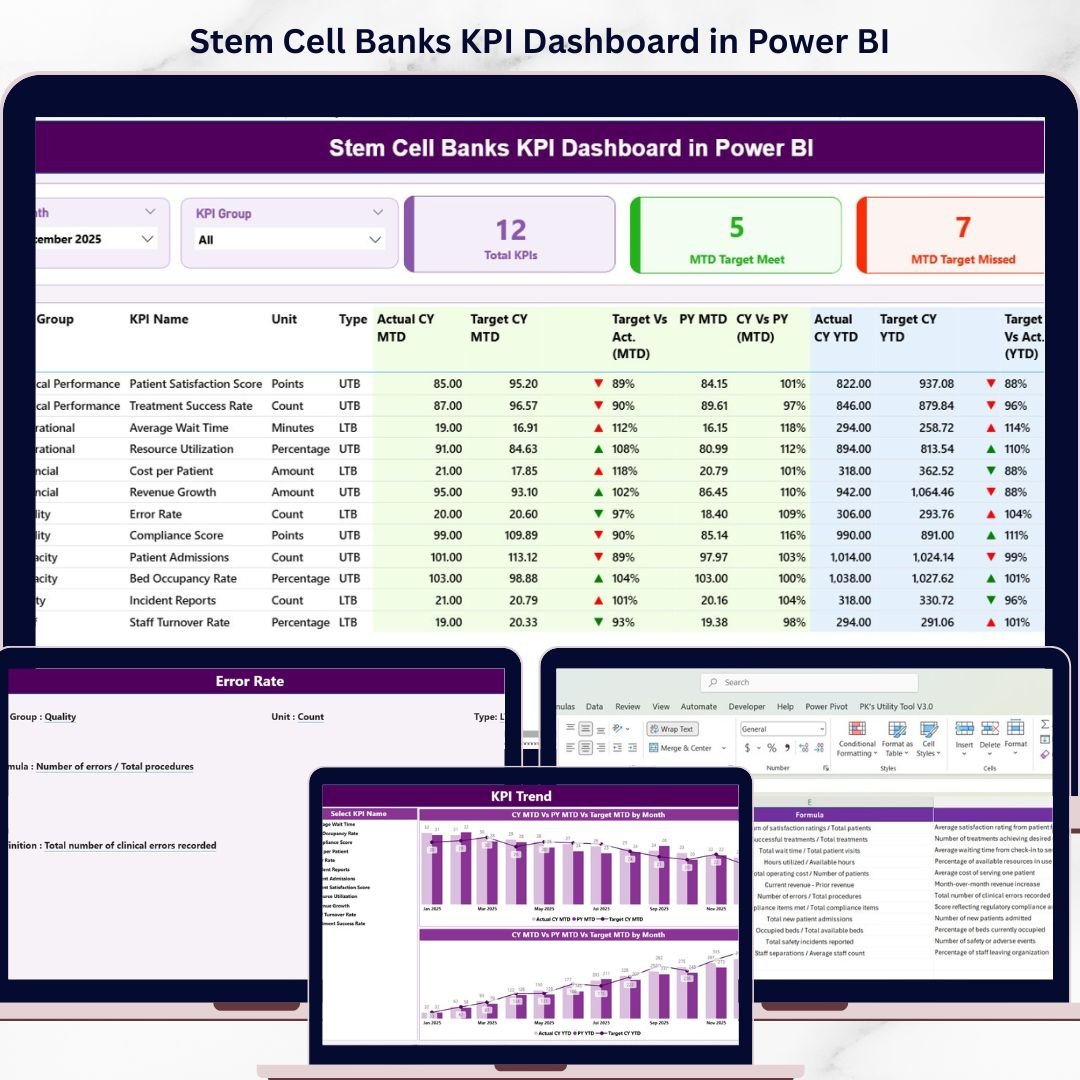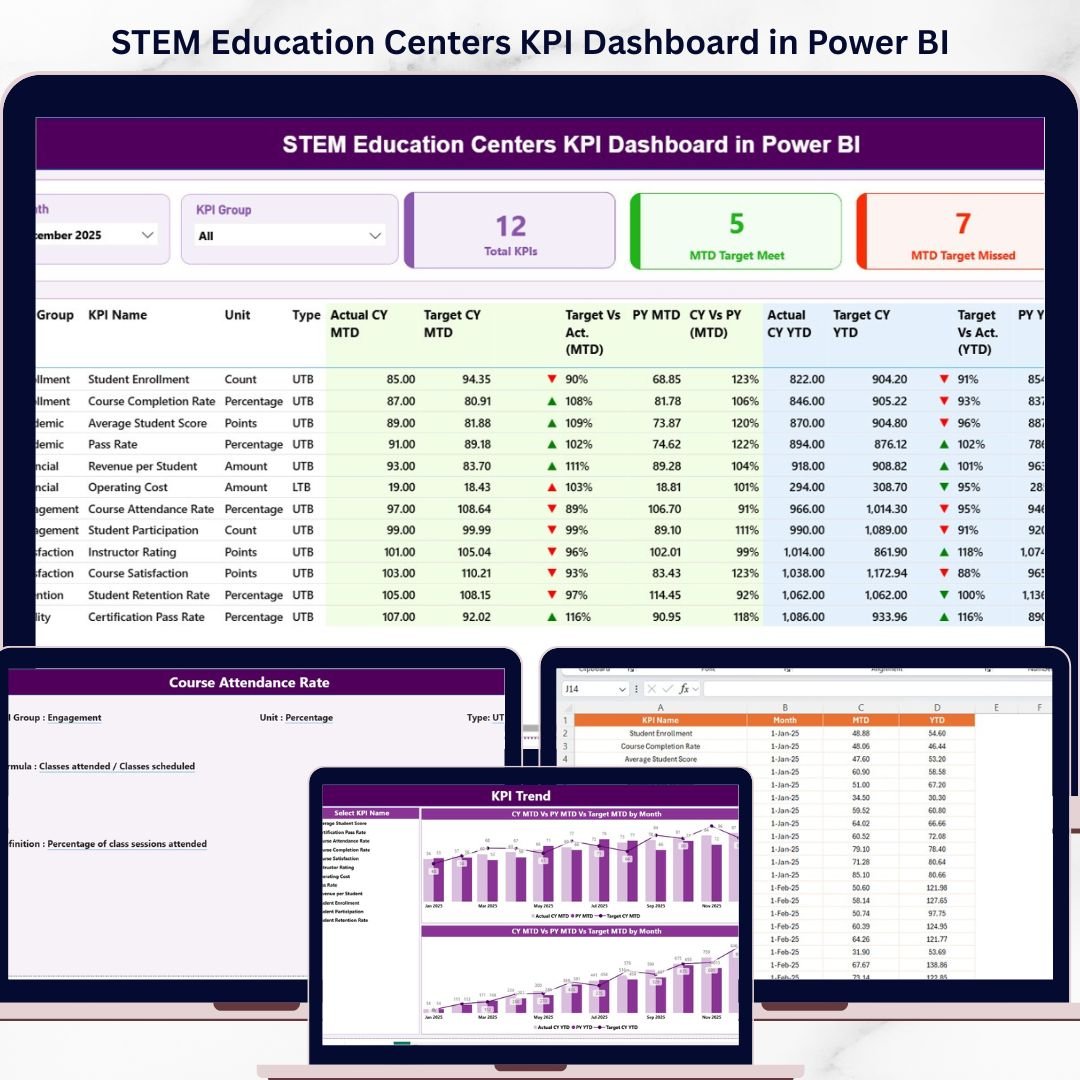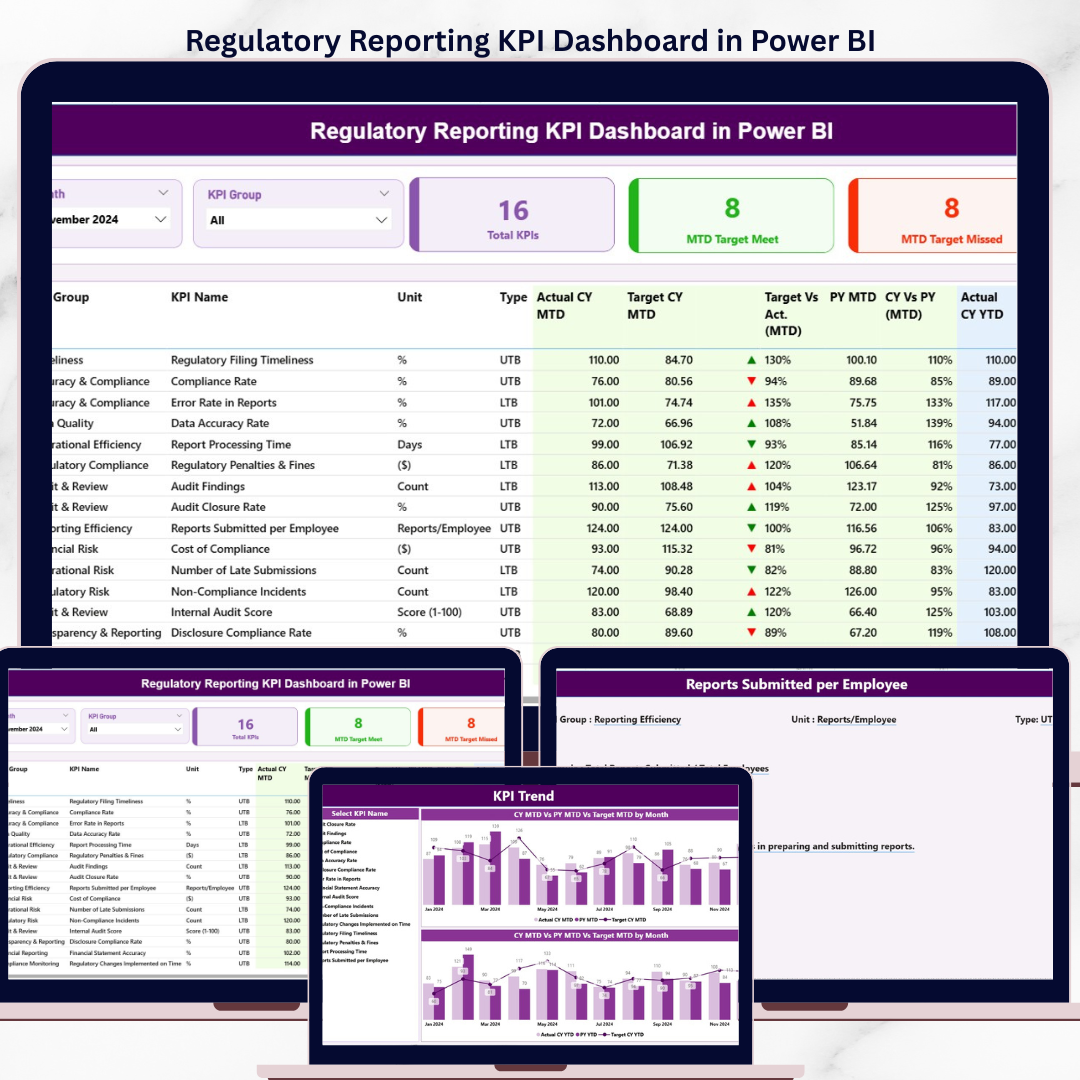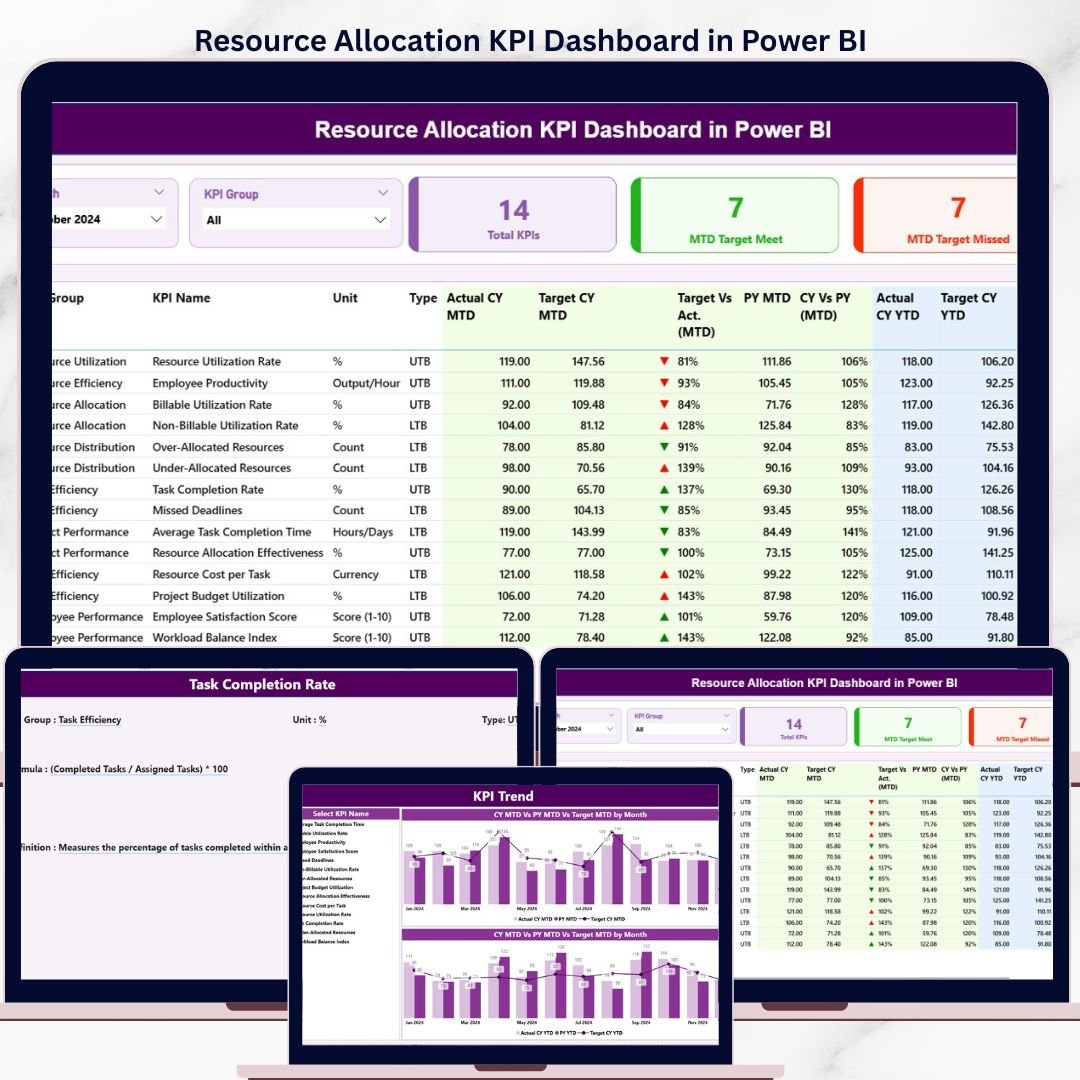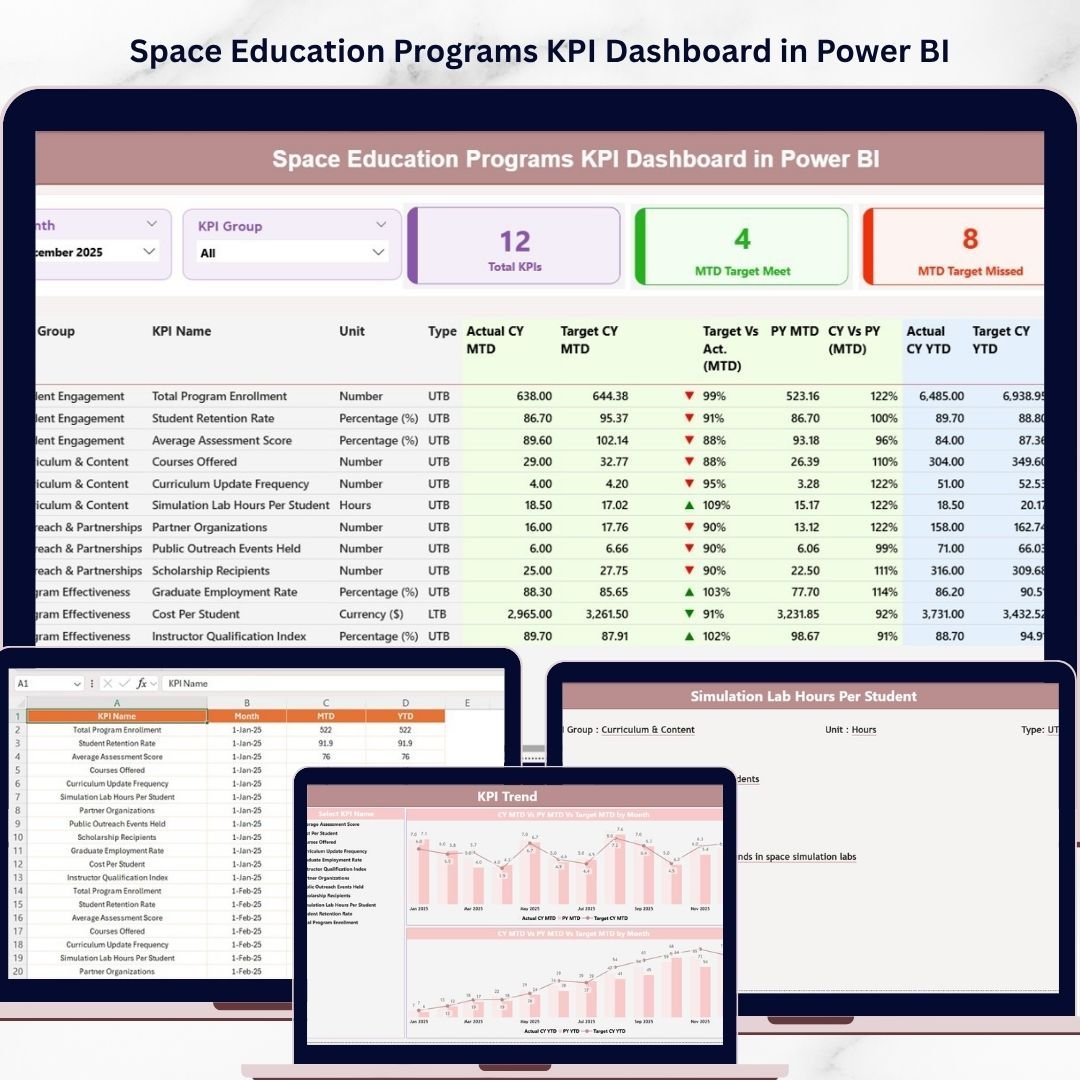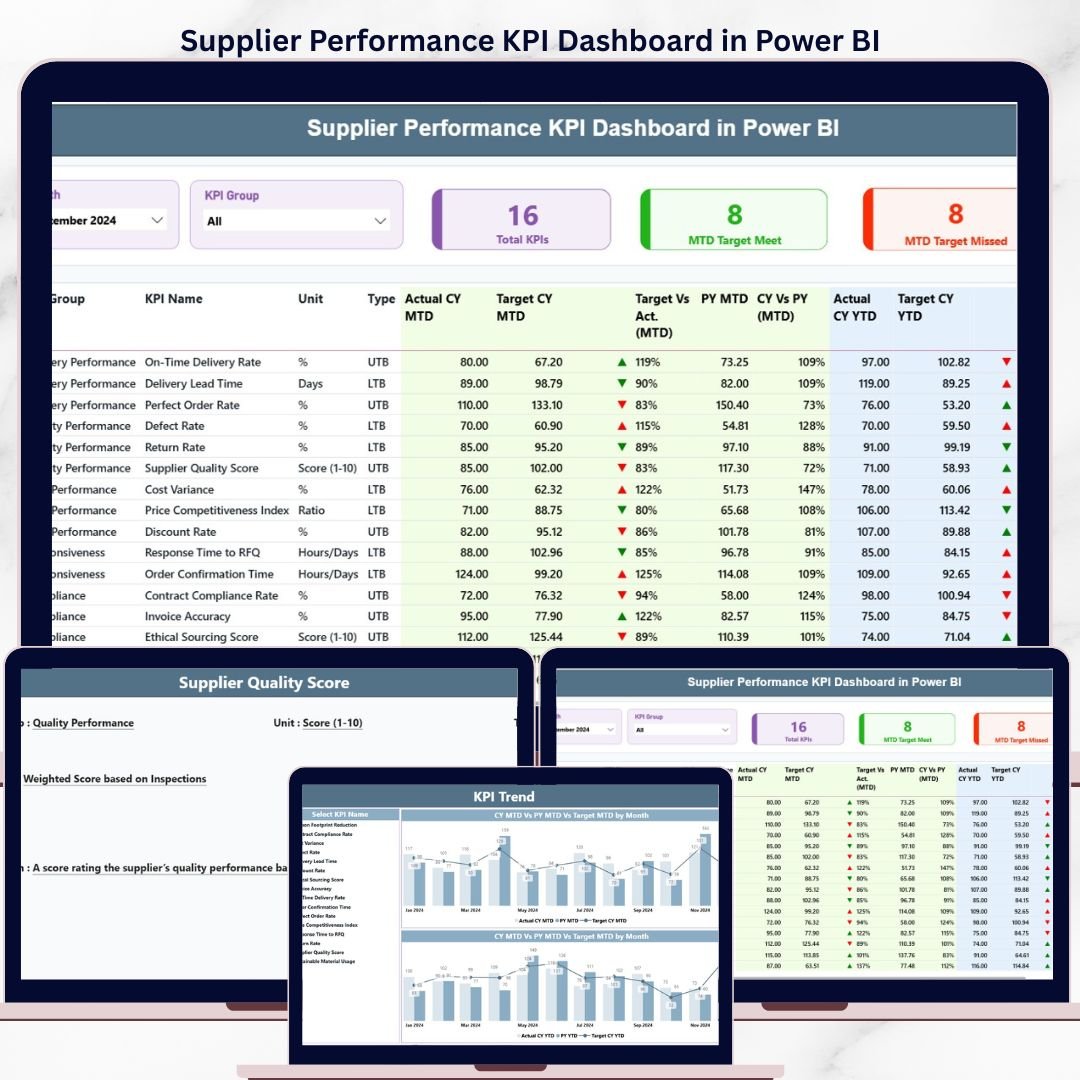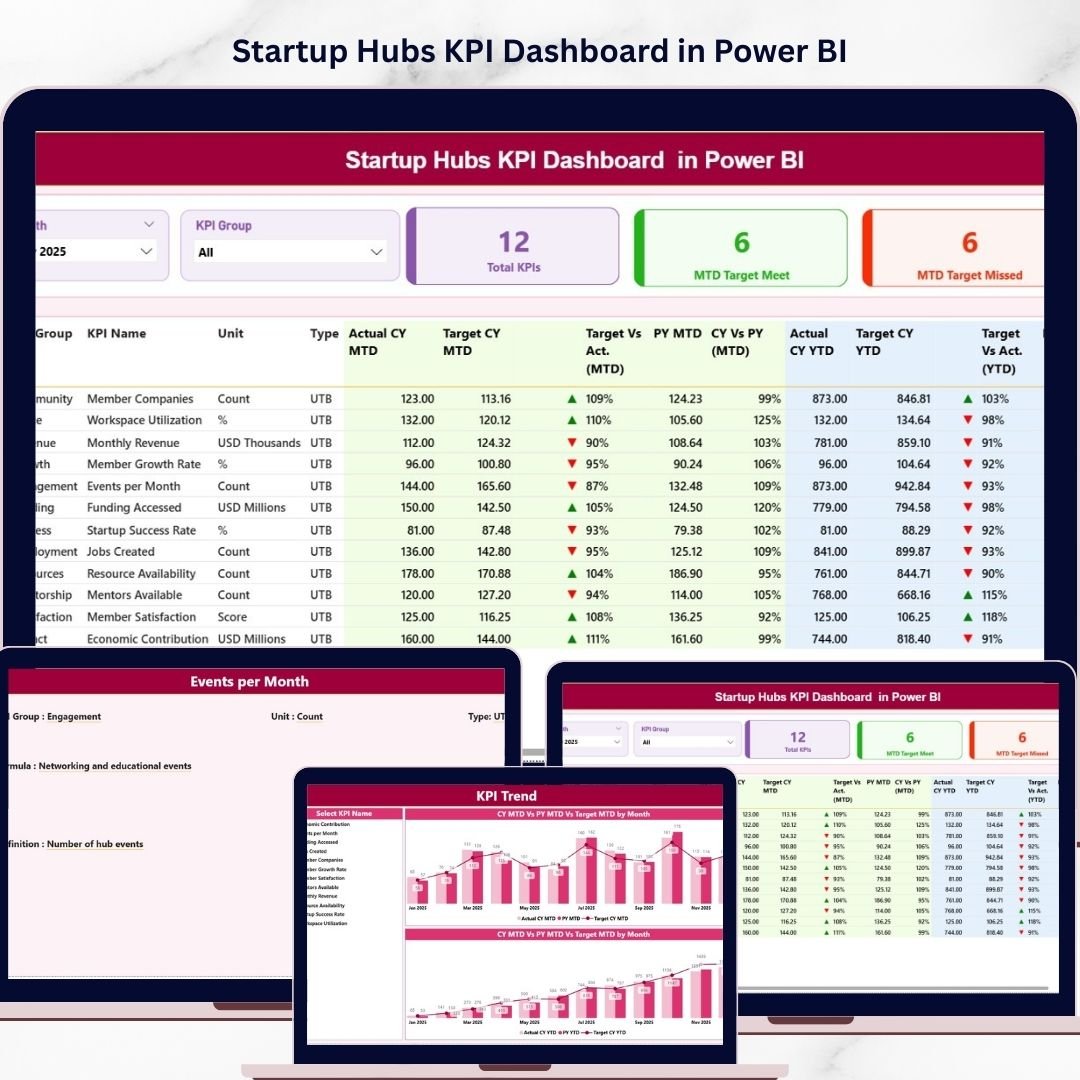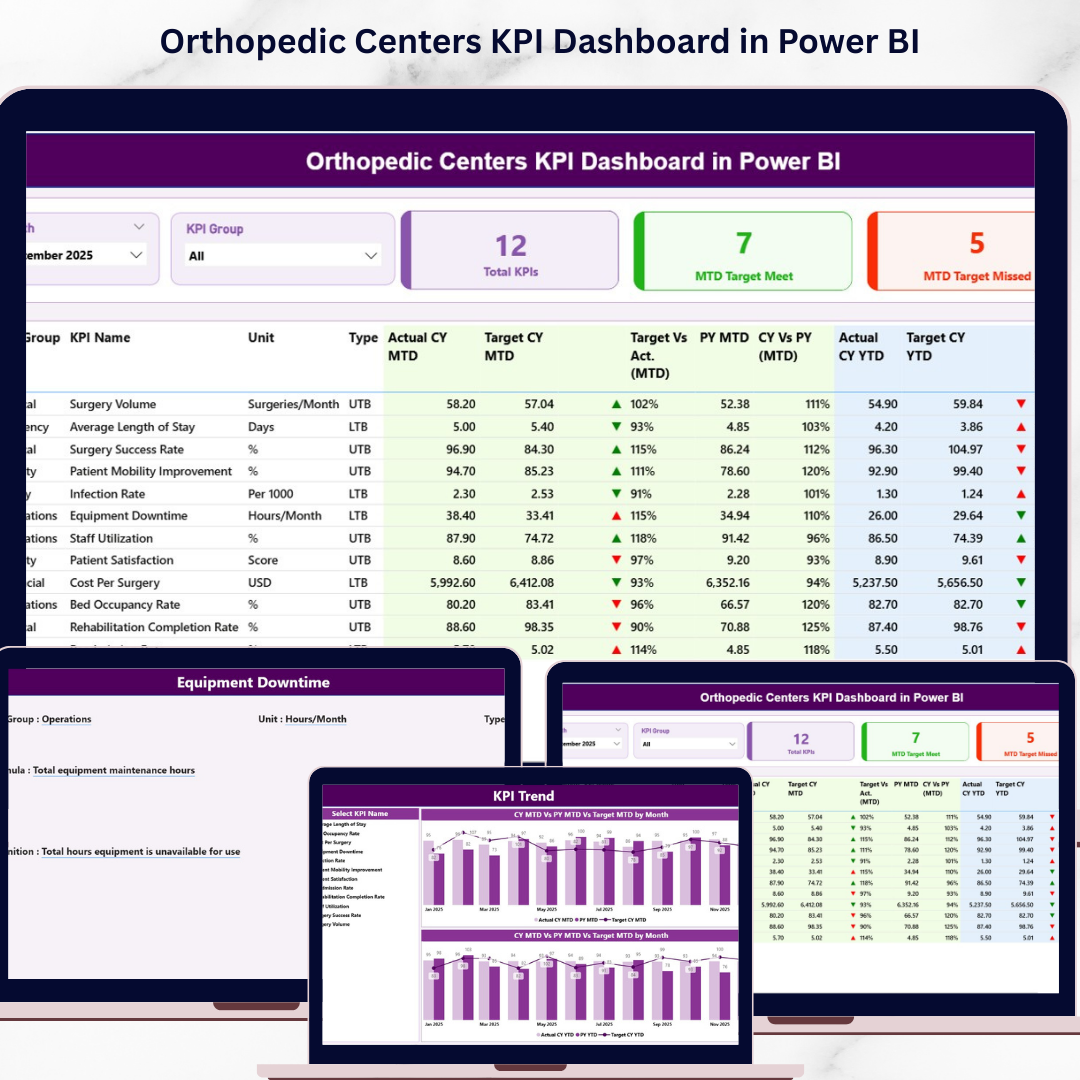
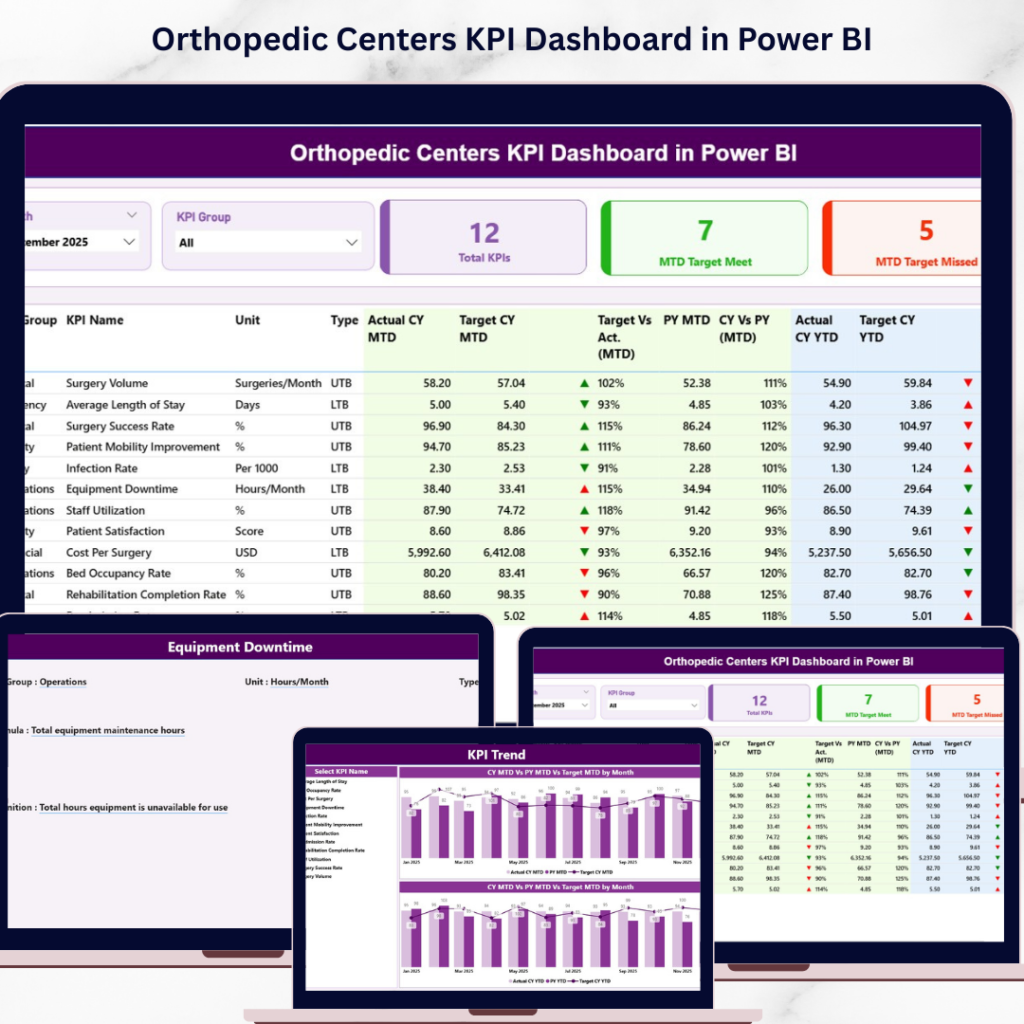
Unlock the Orthopedic Centers KPI Dashboard of your orthopedic center with this advanced Power BI KPI Dashboard ��. Designed for modern healthcare professionals, this dashboard helps you track clinical performance, operational efficiency, and financial KPIs in one centralized platform. Instead of struggling with scattered reports and manual tracking, you can now monitor MTD/YTD performance, compare targets, analyze trends, and make faster decisions using powerful visual analytics. If you want to improve patient care and streamline operations, this dashboard is your ultimate data-driven solution. �� Key Feature of Orthopedic Centers KPI Dashboard in Power BI ✅ �� Interactive Power BI DashboardExperience dynamic visuals, slicers, and real-time insights. ✅ �� Smart Filtering with SlicersFilter data by Month and KPI Group for customized analysis. ✅ �� MTD & YTD Performance TrackingMonitor Actual vs Target vs Previous Year effortlessly. ✅ �� Visual KPI IndicatorsQuickly identify performance using arrows and color indicators. ✅ �� KPI Trend Analysis PageAnalyze trends using combo charts for deeper insights. ✅ �� KPI Definition Drill-ThroughUnderstand KPI formulas, types, and definitions instantly. ✅ �� Excel Data IntegrationEasily connect and update data using structured Excel sheets. �� What’s Inside the Orthopedic Centers KPI Dashboard in Power BI This dashboard includes 3 powerful analytical pages: �� Summary Page – Complete KPI overview with cards, slicers, and detailed tables Orthopedic Centers KPI Dashboard �� KPI Trend Page – Visual charts comparing Actual, Target, and Previous Year�� KPI Definition Page – Drill-through page with KPI formulas and definitions �� Excel Data Source Includes: Input_Actual Sheet Input_Target Sheet KPI Definition Sheet Everything is structured to deliver a complete performance monitoring system. ⚙️ How to Use the Orthopedic Centers KPI Dashboard in Power BI Getting started is quick and easy: �� Enter your data in the Excel input sheets�� Load the data into Power BI�� Use slicers to filter by Month and KPI Group�� Analyze KPI cards and detailed tables�� Explore trends in the KPI Trend Page�� Drill down into KPI details using the Definition Page Within minutes, you can convert raw data into powerful healthcare insights. ��⚕️ Who Can Benefit from This Orthopedic Centers KPI Dashboard in Power BI This dashboard is ideal for: �� Hospital Administrators – Monitor operations and performance��⚕️ Orthopedic Specialists – Track clinical outcomes�� Healthcare Analysts – Analyze trends and KPIs�� Clinic Managers – Improve workflow and efficiency�� Decision Makers – Make fast, data-driven decisions Anyone looking to improve efficiency, accuracy, and performance tracking will benefit from this solution. �� Click hare to read the Detailed blog post Explore the full guide with detailed explanations, use cases, and best practices. �� Visit our YouTube channel to learn step-by-step video tutorials:https://youtube.com/@PKAnExcelExpert Watch the step-by-step video tutorial: