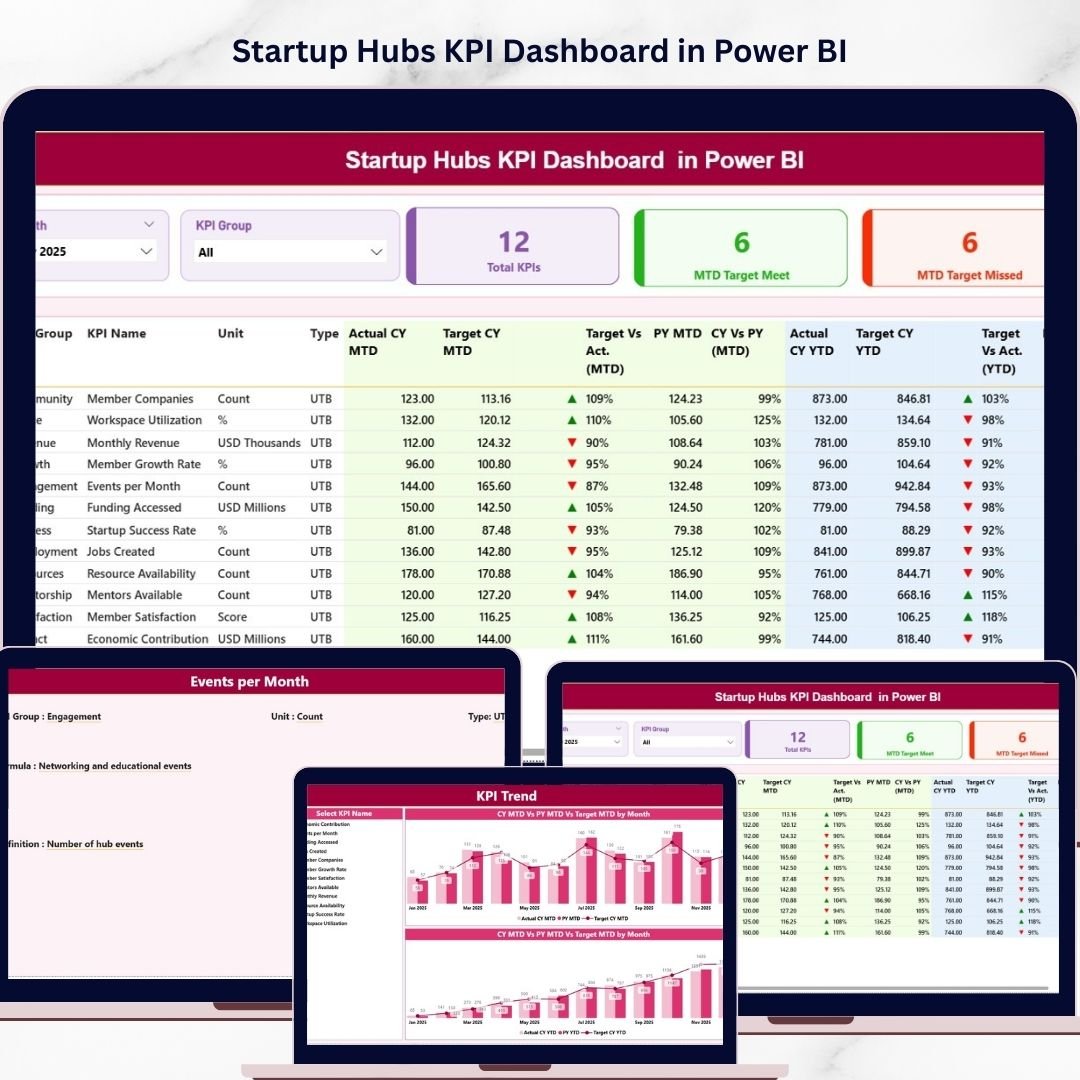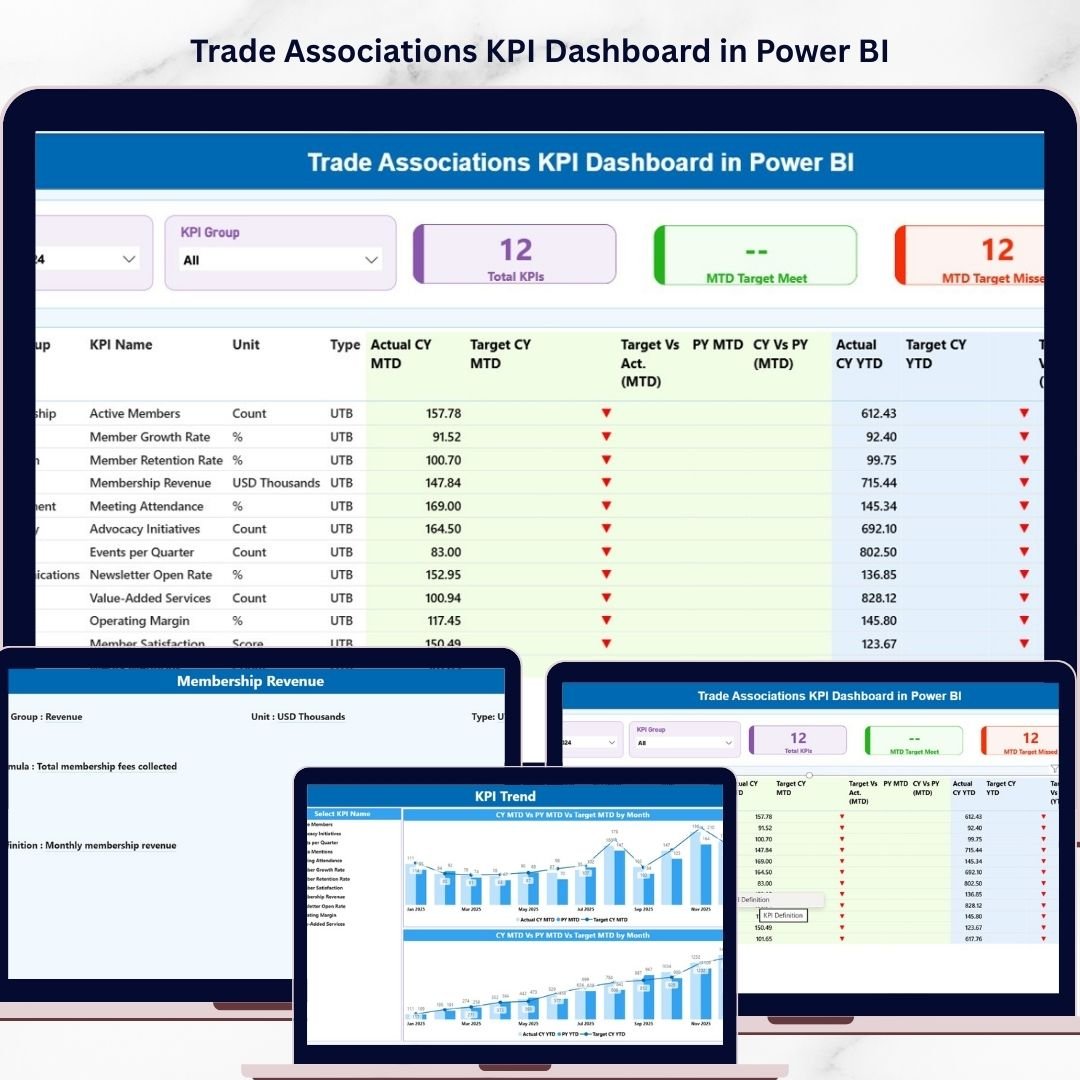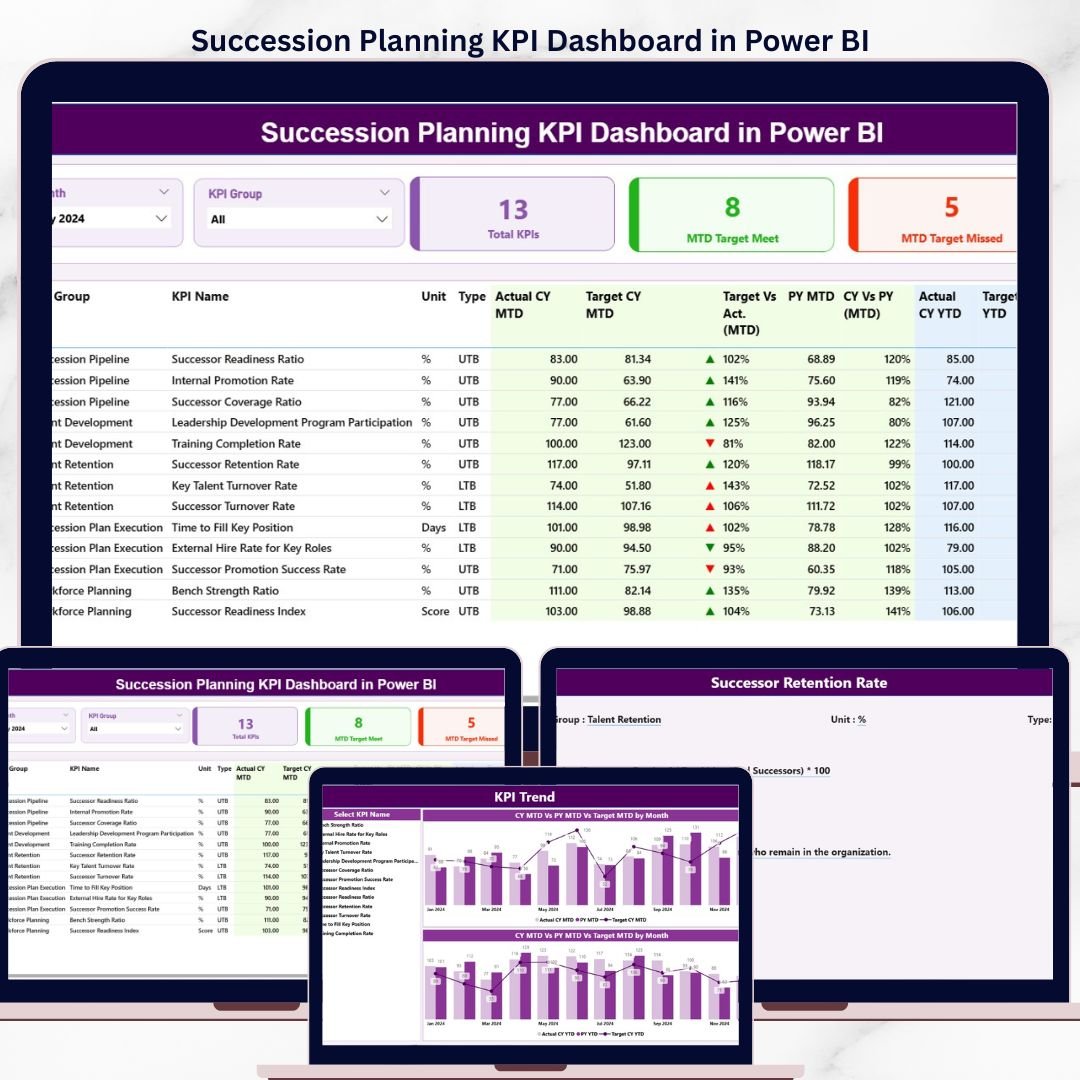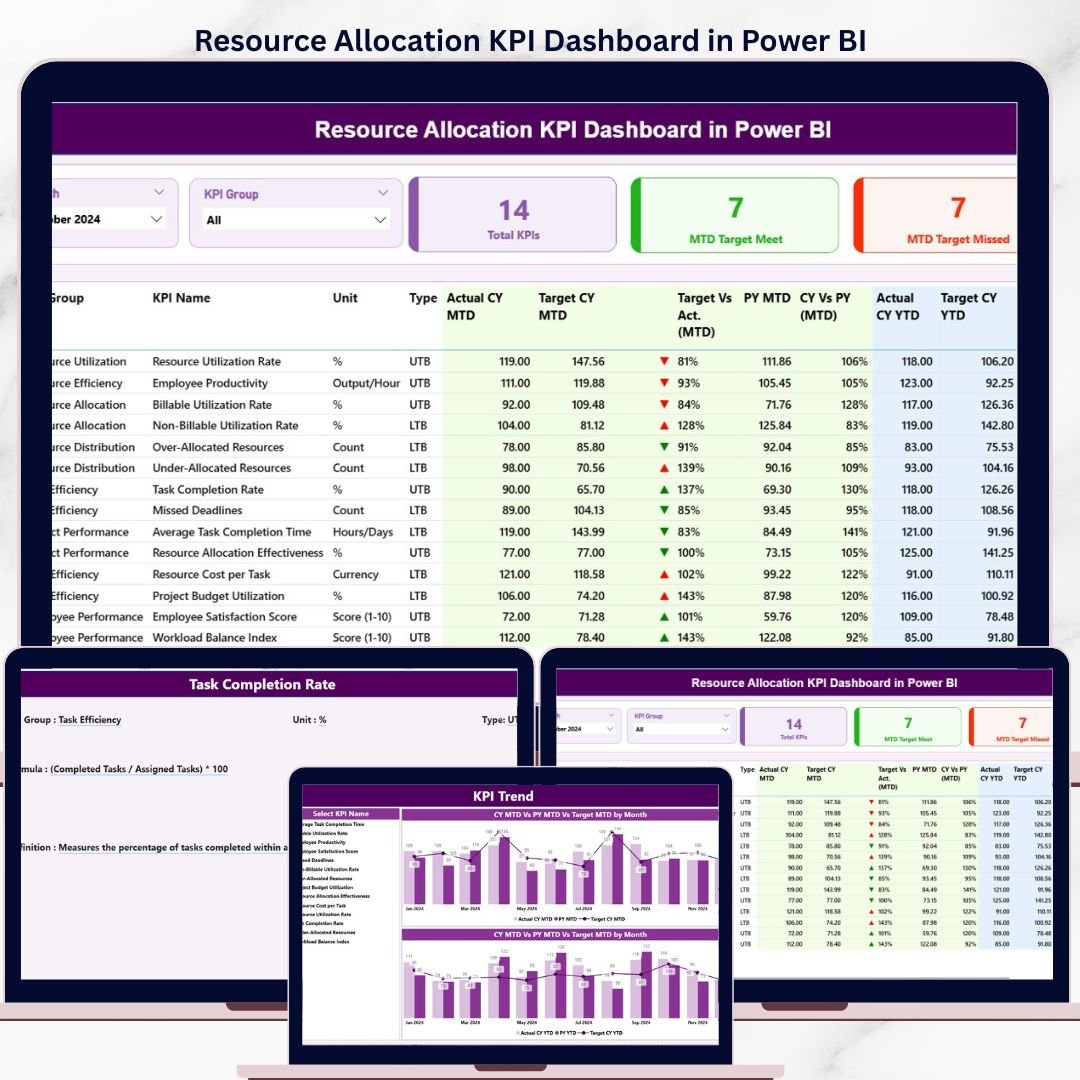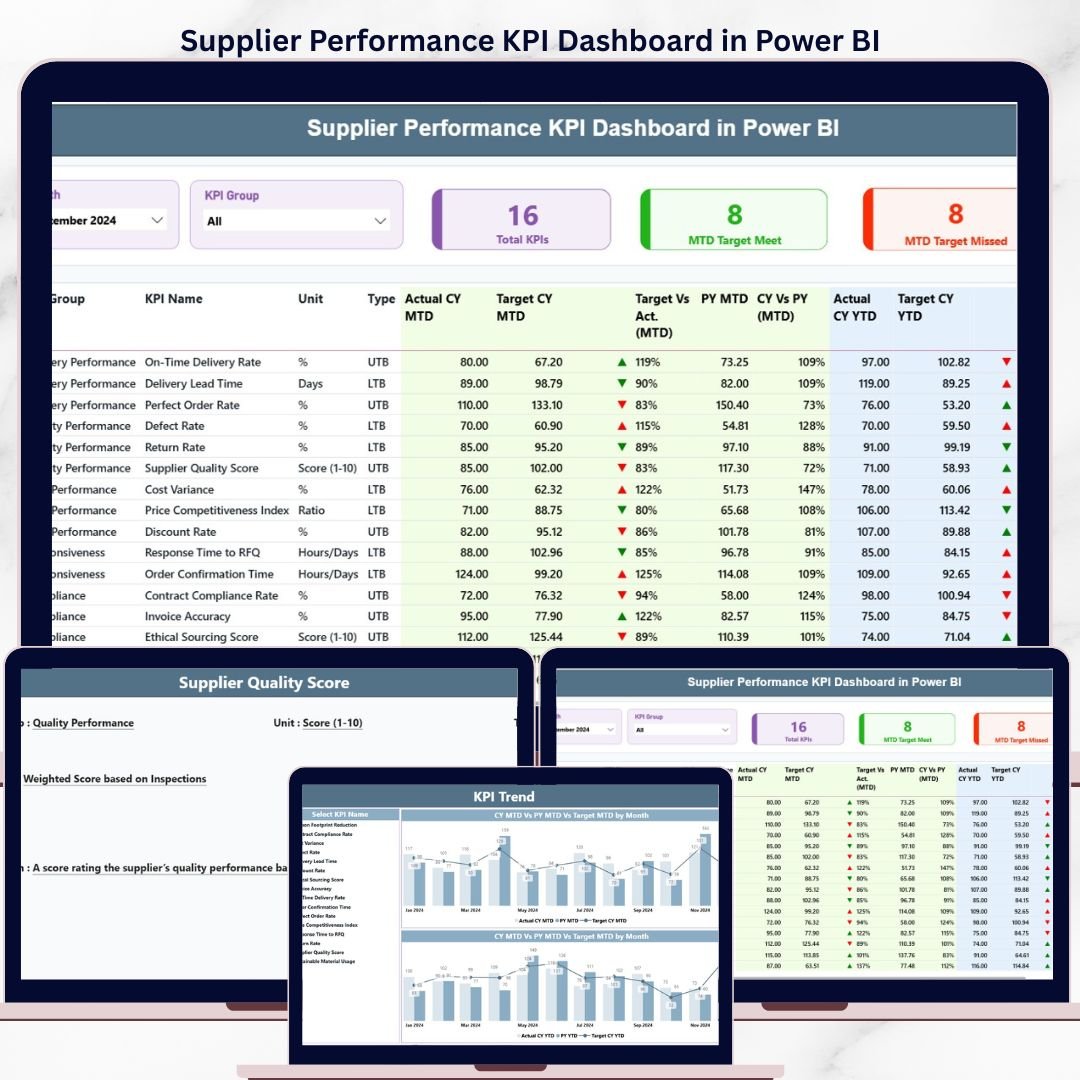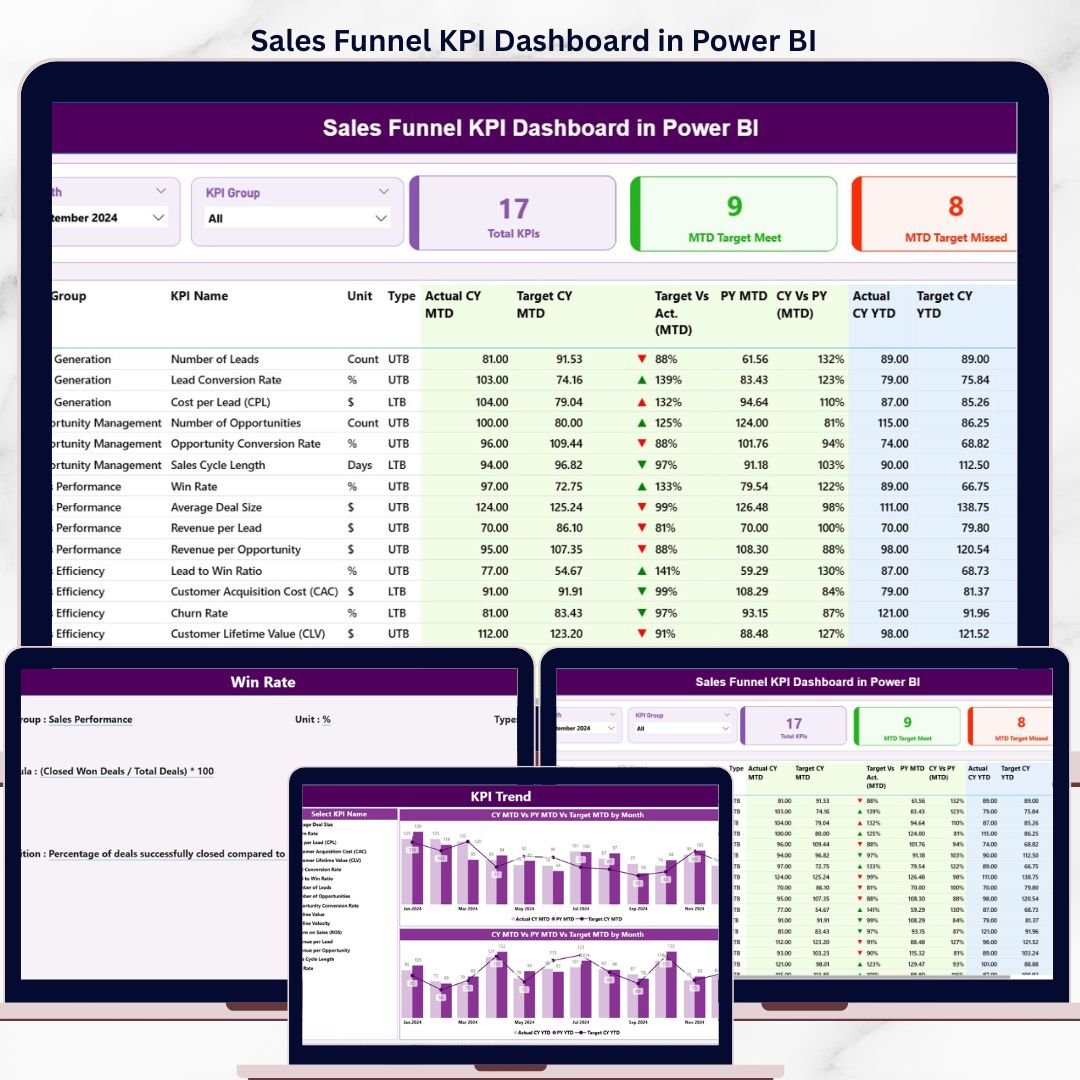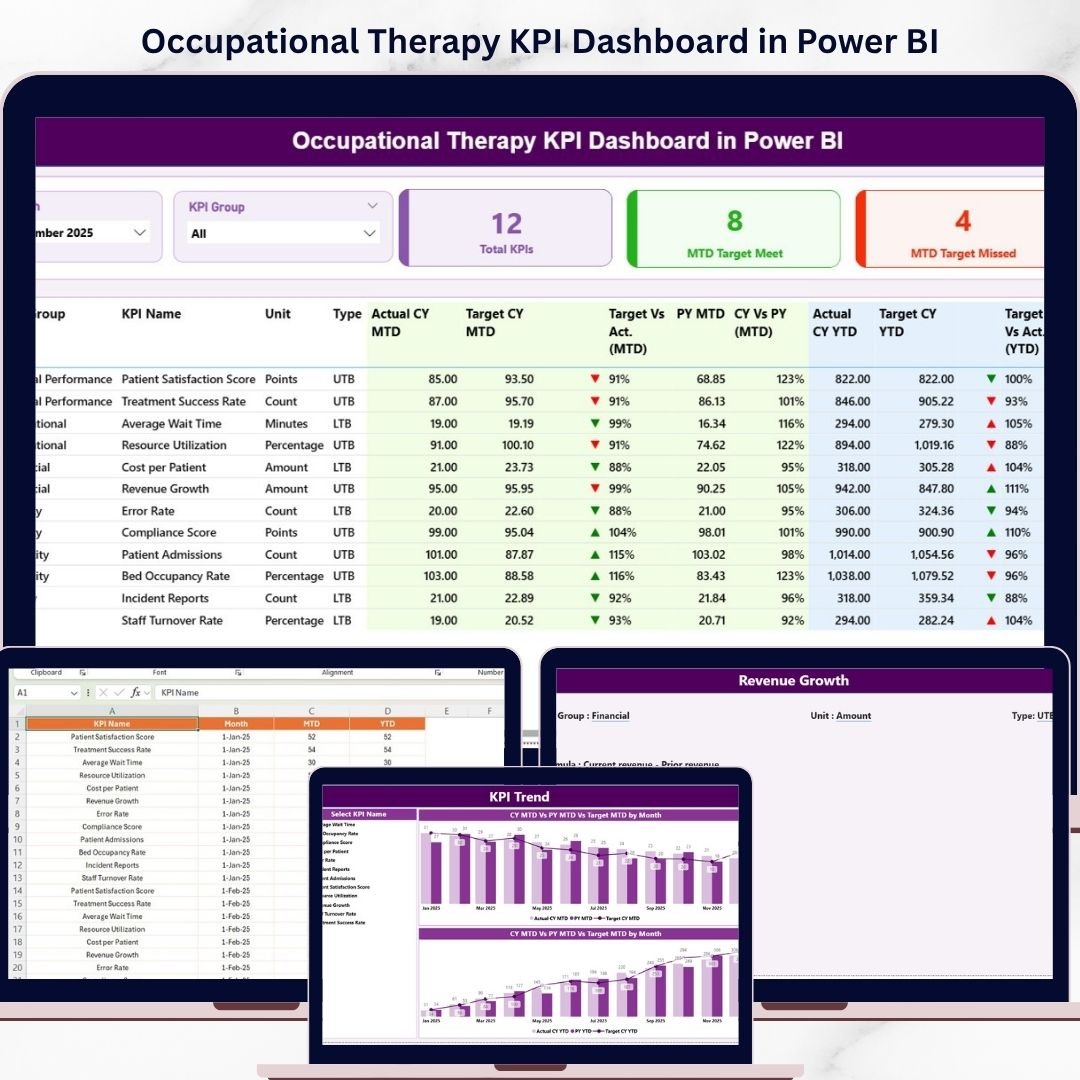
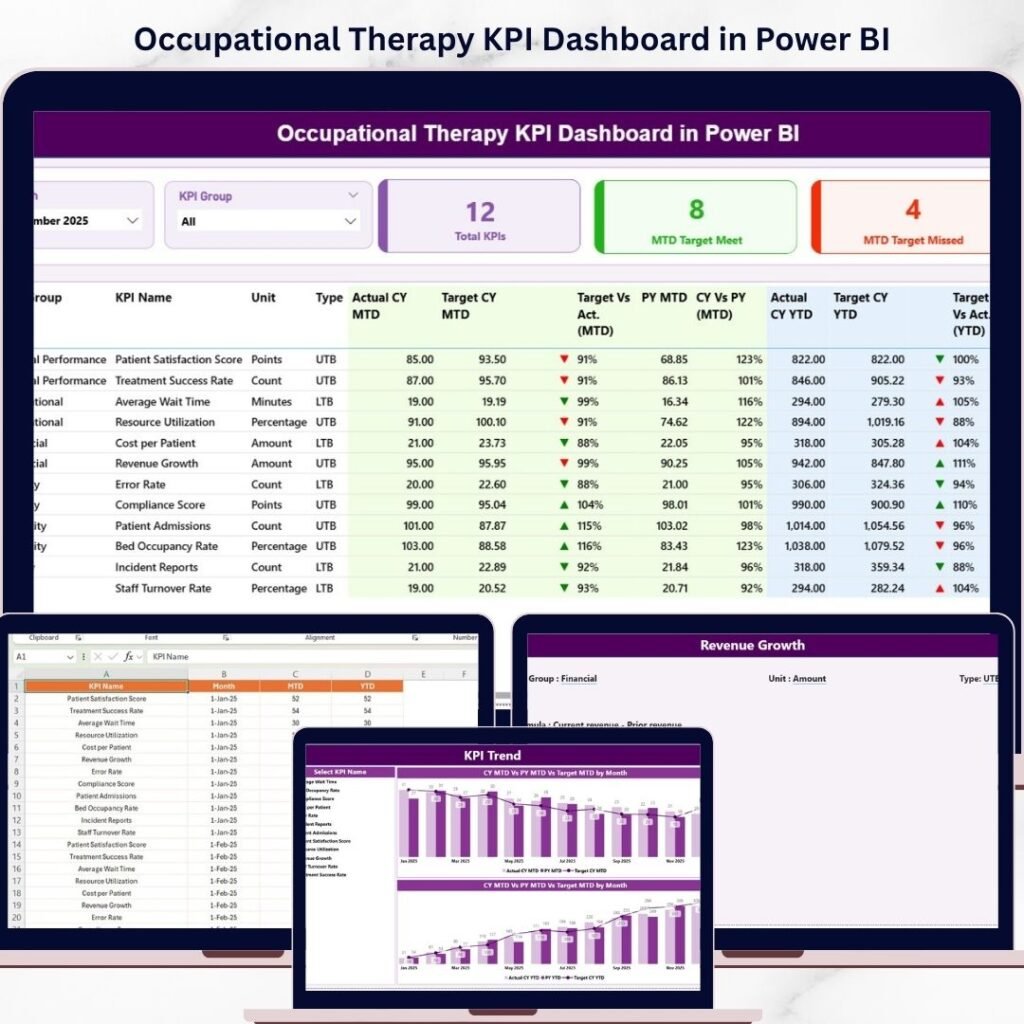
Introducing the Occupational Therapy KPI Dashboard in Power BI — a powerful and interactive tool designed to help healthcare professionals monitor performance, analyze trends, and improve patient outcomes—all in one place. In today’s healthcare landscape, occupational therapy centers must manage large volumes of performance data. However, without a structured system, it becomes difficult to extract meaningful insights and make informed decisions. That’s where this smart dashboard makes a difference! �� It transforms complex therapy data into clear, visual insights. Moreover, it enables real-time KPI tracking, helping you identify performance gaps, optimize operations, and enhance patient care. Occupational Therapy KPI Dashboard in Power BI ✨ Key Features of Occupational Therapy KPI Dashboard in Power BI �� Real-Time KPI MonitoringTrack therapy KPIs with MTD and YTD performance insights in one centralized dashboard. �� Target vs Actual ComparisonEvaluate performance easily by comparing actual outcomes with targets. �� Trend Analysis (MTD & YTD)Analyze therapy performance trends over time using dynamic visuals. �� Year-over-Year ComparisonCompare current performance with previous year data for better insights. �� KPI Definitions & Formulas IncludedUnderstand each KPI clearly with structured definitions and formulas. �� Interactive Filters & SlicersFilter data by month and KPI group for focused analysis. �� Performance IndicatorsVisual arrows and color indicators highlight trends instantly. ⚡ Professional & Dynamic Dashboard DesignClean layout with charts, KPI cards, and detailed tables. �� What’s Inside the Occupational Therapy KPI Dashboard in Power BI �� Summary PageMain dashboard showing KPI cards, slicers, and detailed KPI performance table. �� KPI Trend PageVisual analysis using combo charts for MTD and YTD trends. �� KPI Definition PageDrill-through page with KPI formulas, definitions, and types. �� Excel Data Source IncludedStructured Excel file with Actual Data, Target Data, and KPI Definitions. ��️ How to Use the Occupational Therapy KPI Dashboard in Power BI Using this dashboard is simple and user-friendly! �� 1️⃣ Enter KPI DefinitionsInput KPI details in the Excel file. 2️⃣ Add Target DataEnter monthly KPI targets. 3️⃣ Input Actual DataAdd performance data for MTD and YTD. 4️⃣ Refresh DashboardLoad updated data into Power BI. 5️⃣ Apply Filters & SlicersSelect month or KPI group for analysis. 6️⃣ Analyze & ImproveIdentify gaps and improve therapy outcomes. �� Who Can Benefit from This Occupational Therapy KPI Dashboard in Power BI �� Occupational Therapy Clinics – Track patient outcomes and performance��⚕️ Therapists – Monitor therapy effectiveness�� Healthcare Analysts – Analyze KPI trends�� Hospital Management – Improve operational efficiency�� Healthcare Administrators – Make data-driven decisions �� Why This Dashboard is a Must-Have? ✔ Monitor therapy KPIs in real time✔ Improve patient outcomes✔ Standardize KPI tracking✔ Reduce manual reporting✔ Make faster, data-driven decisions �� If you want to improve therapy performance and deliver better patient care, this dashboard is your ultimate solution! �� Click here to read the Detailed blog post �� Visit our YouTube channel to learn step-by-step video tutorials �� YouTube.com/@PKAnExcelExpert