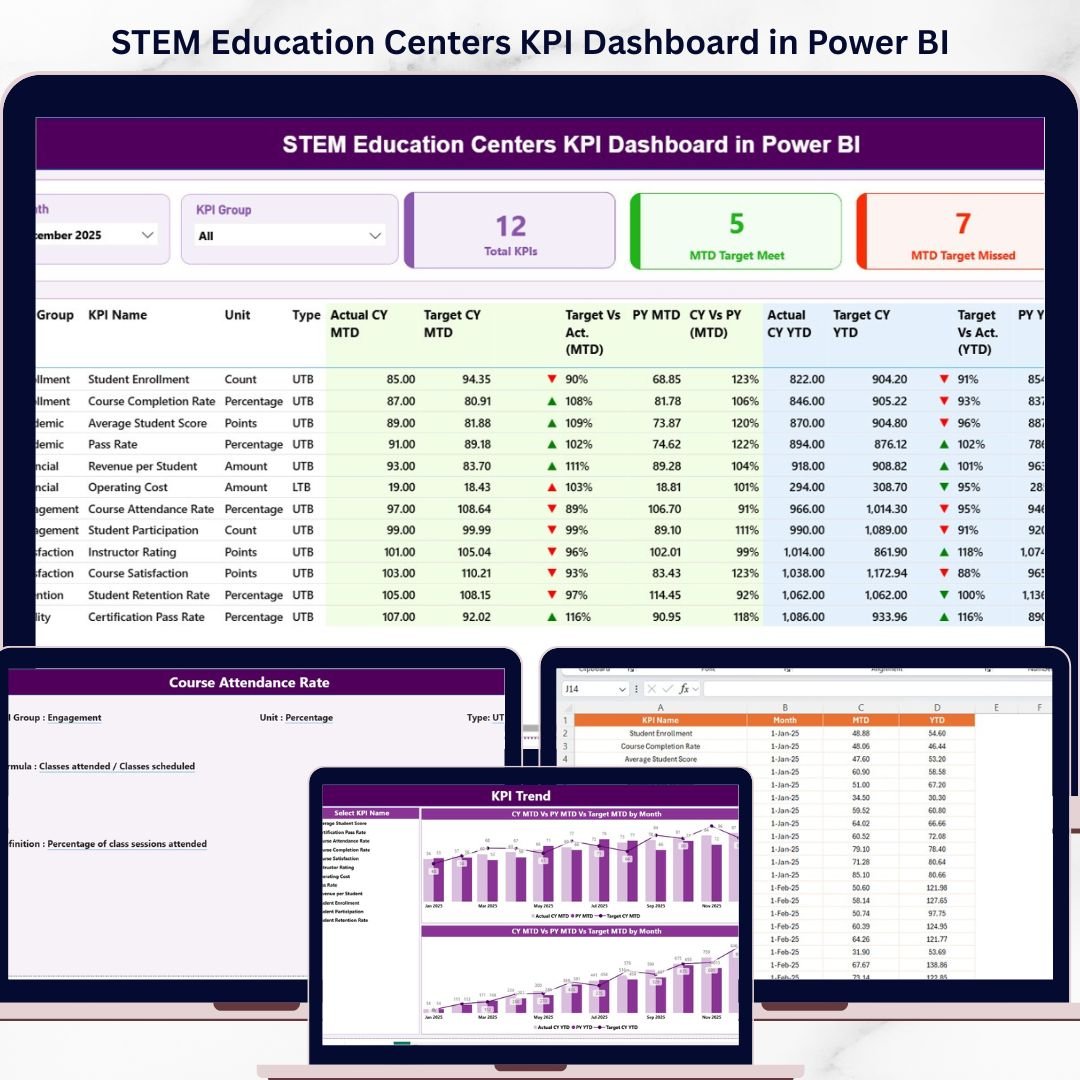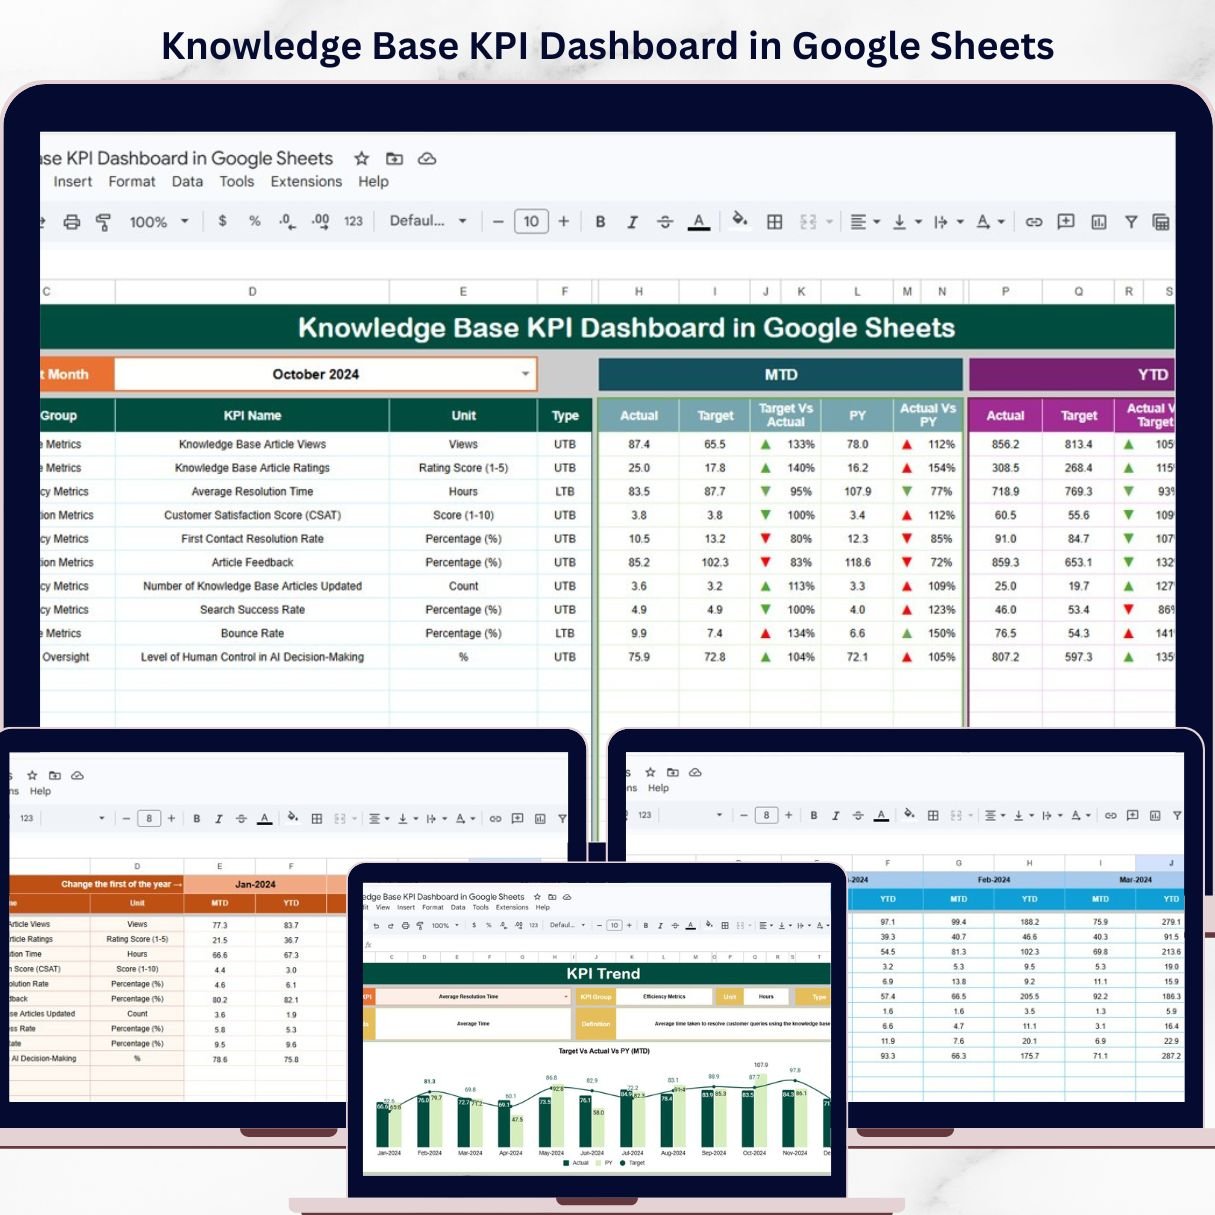
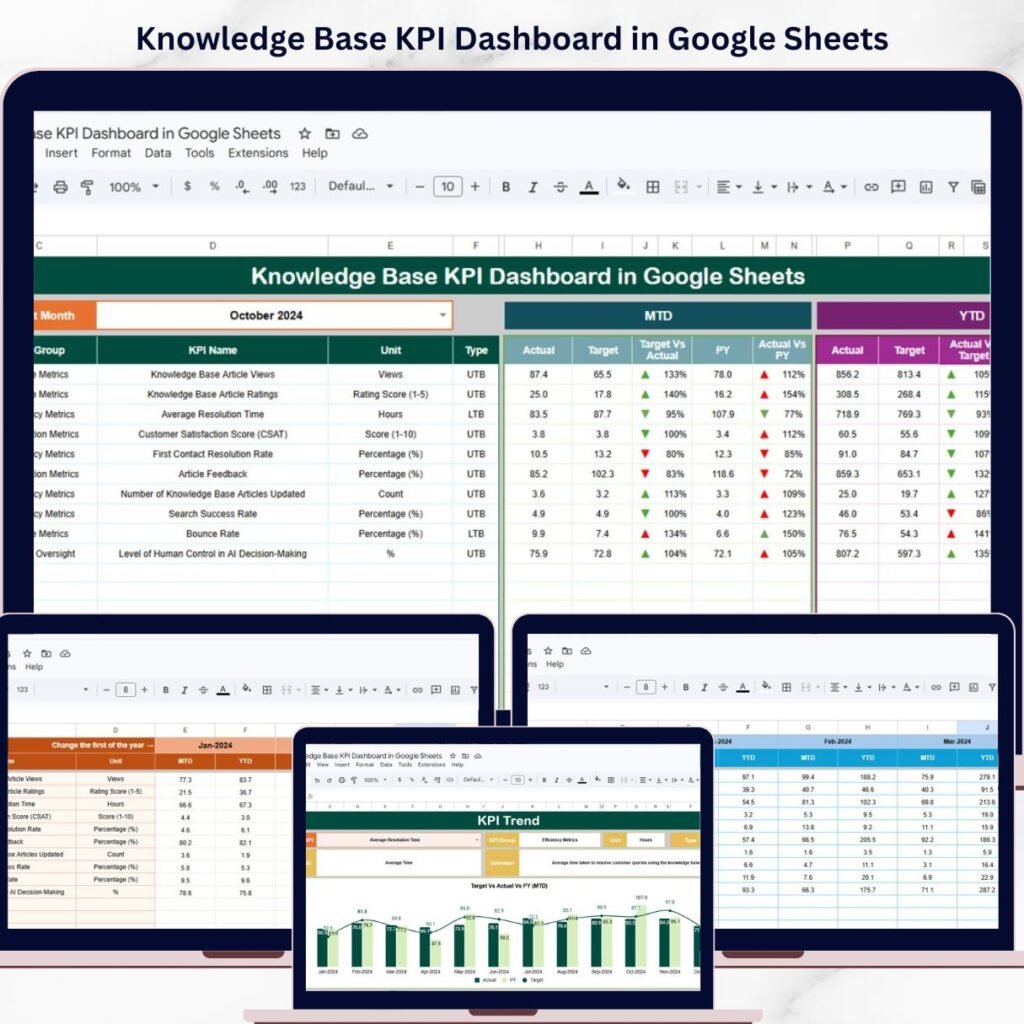
Introducing the Knowledge Base KPI Dashboard in Google Sheets — a powerful, ready-to-use tool designed to help you track performance, monitor KPIs, and optimize your knowledge management system with ease. In today’s knowledge-driven environment, organizations rely heavily on internal documentation and support content. However, without proper tracking, it becomes difficult to evaluate performance or improve efficiency. ✨ Key Features of Knowledge Base KPI Dashboard in Google Sheets �� Centralized KPI DashboardTrack all your KPIs in one place with dynamic MTD and YTD performance metrics. �� Monthly Performance TrackingSelect any month and instantly update all dashboard visuals. �� Actual vs Target vs Previous Year ComparisonEvaluate performance with clear comparisons and trend indicators. �� Conditional Formatting IndicatorsVisual arrows highlight KPI performance instantly. �� Detailed KPI Trend AnalysisAnalyze individual KPIs with complete context including definitions and formulas. �� KPI Documentation IncludedAccess KPI group, unit, formula, and definition in one structured sheet. ⚡ Interactive & User-Friendly DesignSimple inputs, dropdowns, and filters make analysis quick and easy. �� Data-Driven InsightsMake smarter decisions with clear performance tracking and trend analysis. �� What’s Inside the Knowledge Base KPI Dashboard in Google Sheets �� Dashboard SheetThe main control panel showing MTD & YTD metrics with comparisons and visual indicators. �� KPI Trend SheetDeep dive into individual KPIs with dropdown selection and detailed information. �� Actual Number SheetInput current performance data including MTD and YTD values. �� Target SheetSet KPI targets for monthly performance tracking. �� Previous Year SheetStore historical data for year-over-year comparison. �� KPI Definition SheetComplete repository of KPI names, formulas, units, and definitions. ��️ How to Use the Knowledge Base KPI Dashboard in Google Sheets Using this dashboard is simple—even if you’re not an expert! �� 1️⃣ Enter KPI DataInput actual performance values in the Actual sheet. 2️⃣ Set TargetsDefine KPI targets in the Target sheet. 3️⃣ Add Previous Year DataInput historical data for comparison. 4️⃣ Select MonthChoose the desired month from the dropdown. 5️⃣ Analyze DashboardReview KPIs, charts, and performance indicators. 6️⃣ Take ActionIdentify gaps and improve knowledge base performance. �� Who Can Benefit from This Knowledge Base KPI Dashboard in Google Sheets �� Knowledge Managers – Monitor and improve content performance�� Support Teams – Enhance efficiency and reduce resolution time�� Data Analysts – Analyze KPI trends and insights�� Business Managers – Improve decision-making with data�� Customer Support Teams – Boost user satisfaction and service quality �� Why This Dashboard is a Must-Have? ✔ Track KPIs in real time✔ Standardize KPI definitions✔ Improve knowledge base performance✔ Reduce manual reporting✔ Make faster, data-driven decisions �� If you want to optimize your knowledge base and boost performance, this dashboard is your ultimate solution! �� Click here to read the Detailed blog post �� Visit our YouTube channel to learn step-by-step video tutorials �� YouTube.com/@PKAnExcelExpert