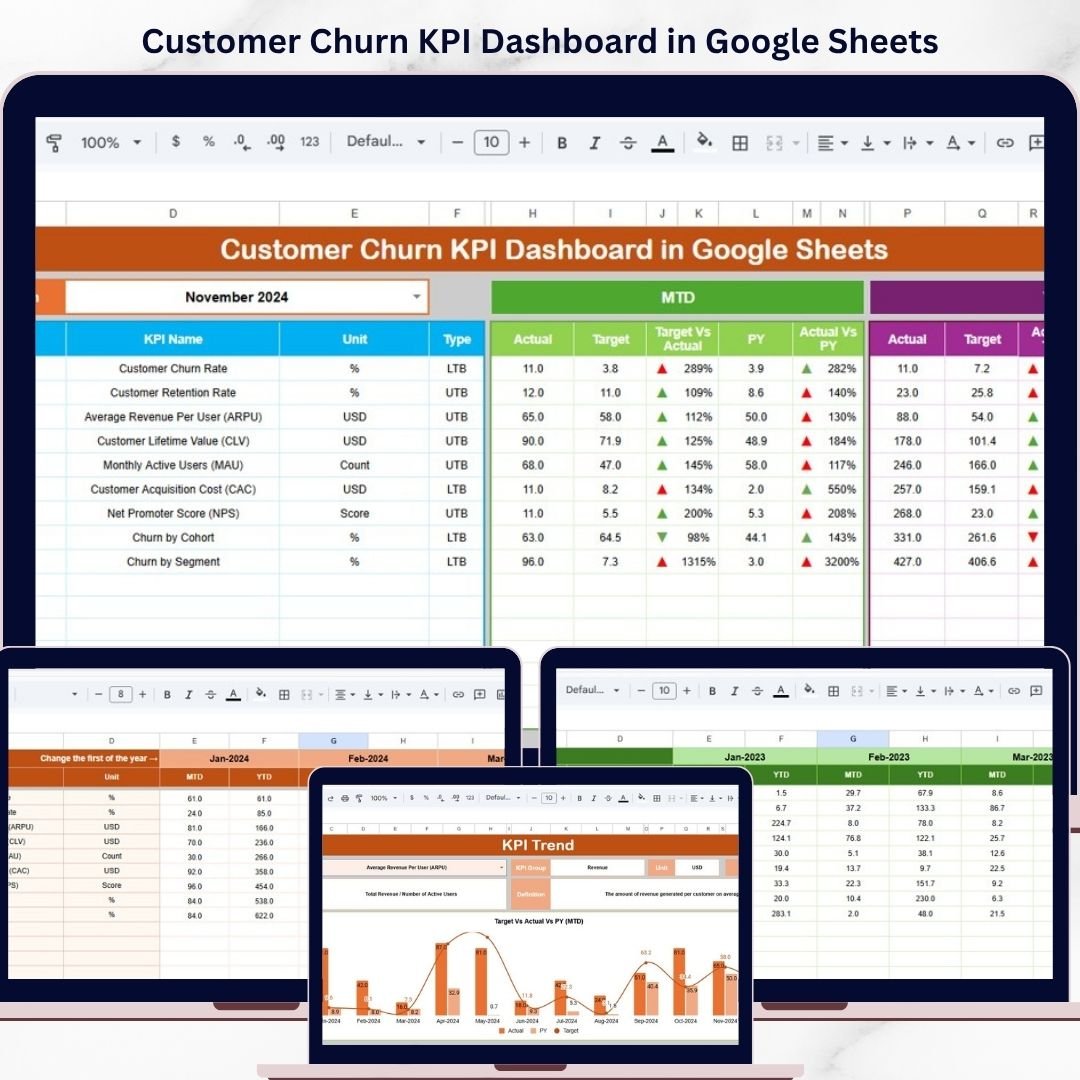
Customer churn can silently impact your business growth if not tracked properly. Losing customers without understanding the reasons behind it can lead to missed opportunities and declining revenue. Introducing the Customer Churn KPI Dashboard in Google Sheets – a smart, ready-to-use solution designed to help you track customer retention, identify churn patterns, and make data-driven decisions effortlessly. This interactive Google Sheets dashboard transforms complex churn data into simple, easy-to-understand insights. Moreover, it allows you to monitor Month-to-Date (MTD) and Year-to-Date (YTD) performance, compare actual vs target vs previous year, and quickly identify areas that need improvement. Whether you are a business owner, marketer, or analyst, this dashboard gives you complete visibility into your customer lifecycle and retention performance. Customer Churn KPI Dashboard in Google Sheets �� Key Features of Customer Churn KPI Dashboard in Google Sheets �� Interactive KPI Dashboard – Track churn metrics with dynamic monthly selection�� MTD & YTD Analysis – Compare actual, target, and previous year performance�� Trend Visualization – Monitor churn patterns over time with charts�� Conditional Formatting Indicators – Instantly identify performance gaps�� Detailed KPI Definitions – Understand each KPI with formulas and explanations�� Structured Data Input Sheets – Easily input actual, target, and historical data�� Seamless Navigation – Switch between sheets using dropdowns and controls�� Google Sheets Accessibility – Access and collaborate anytime, anywhere �� What’s Inside the Customer Churn KPI Dashboard in Google Sheets This template includes multiple well-structured sheets for complete churn analysis: �� Dashboard Sheet – View all KPIs with MTD and YTD comparisons in one place�� KPI Trend Sheet – Analyze individual KPI trends and performance insights�� Actual Data Sheet – Input real-time churn data�� Target Data Sheet – Set KPI benchmarks for performance comparison�� Previous Year Sheet – Track historical churn data�� KPI Definition Sheet – Maintain KPI details including formulas and types Additionally, the dashboard includes dynamic charts, dropdown filters, and automated comparisons to simplify your analysis process. ⚙️ How to Use the Customer Churn KPI Dashboard in Google Sheets Getting started is quick and simple: 1️⃣ Enter Data – Input actual, target, and previous year churn data2️⃣ Select Month – Choose the desired month using the dropdown3️⃣ Review Dashboard – Instantly view updated KPI metrics4️⃣ Analyze Trends – Use the KPI Trend sheet for deeper insights5️⃣ Take Action – Improve retention strategies based on insights �� Within minutes, you can transform your churn data into actionable strategies. �� Who Can Benefit from This Customer Churn KPI Dashboard in Google Sheets This dashboard is ideal for professionals across industries: ���� Business Owners – Monitor customer retention and revenue impact�� Marketing Teams – Identify churn patterns and optimize campaigns�� Data Analysts – Perform detailed churn analysis�� Customer Success Teams – Improve retention and engagement�� Startups & Enterprises – Scale with data-driven decision-making �� In short, anyone focused on customer retention and growth will benefit from this tool. With its intuitive design, real-time updates, and powerful analytics, this dashboard helps you reduce churn, improve customer loyalty, and boost long-term profitability. Stop guessing why customers leave—start making smarter decisions today. �� Download now and take control of your customer retention strategy! �� �� Click here to read the Detailed blog post �� Visit our YouTube channel to learn step-by-step video tutorials �� https://www.youtube.com/@PKAnExcelExpert