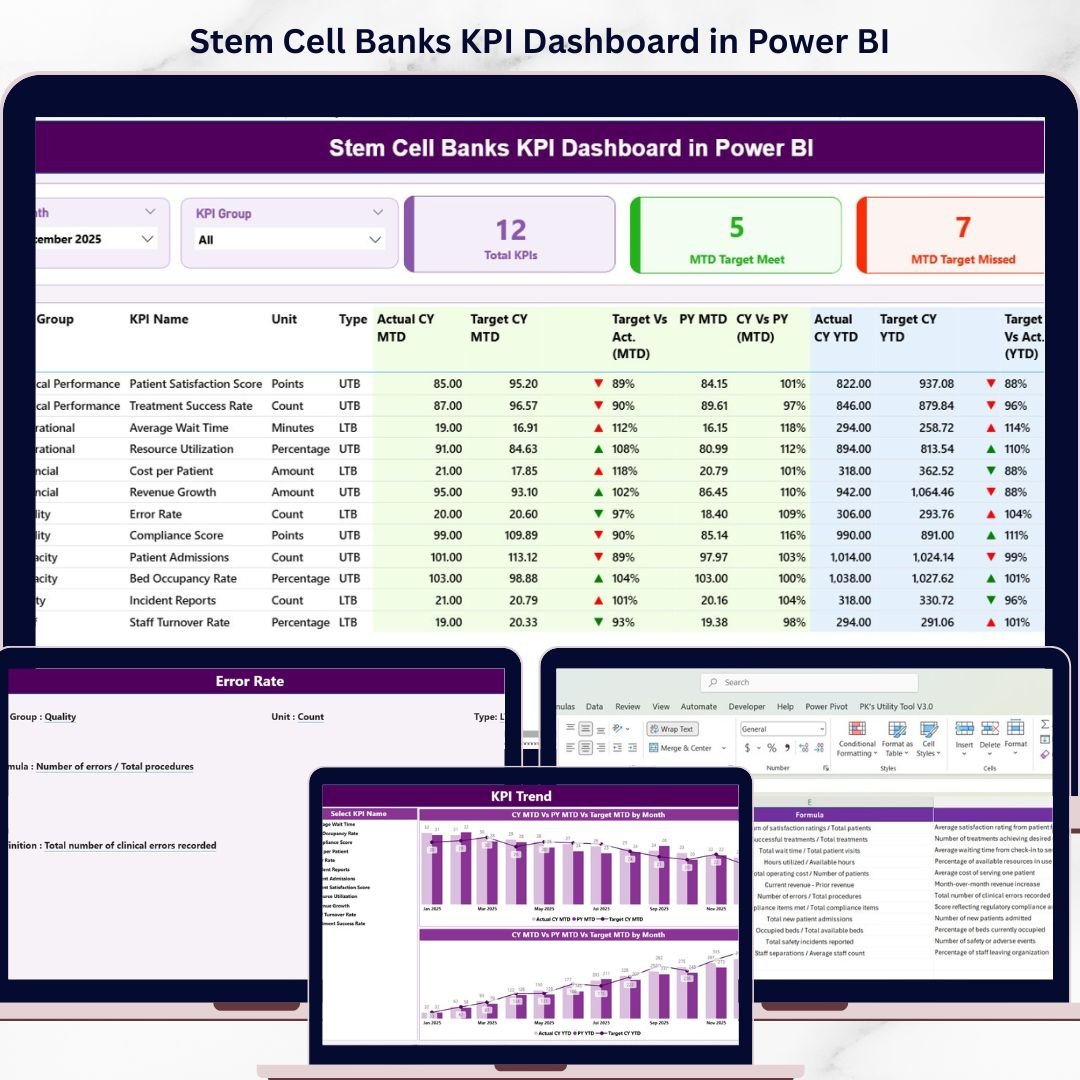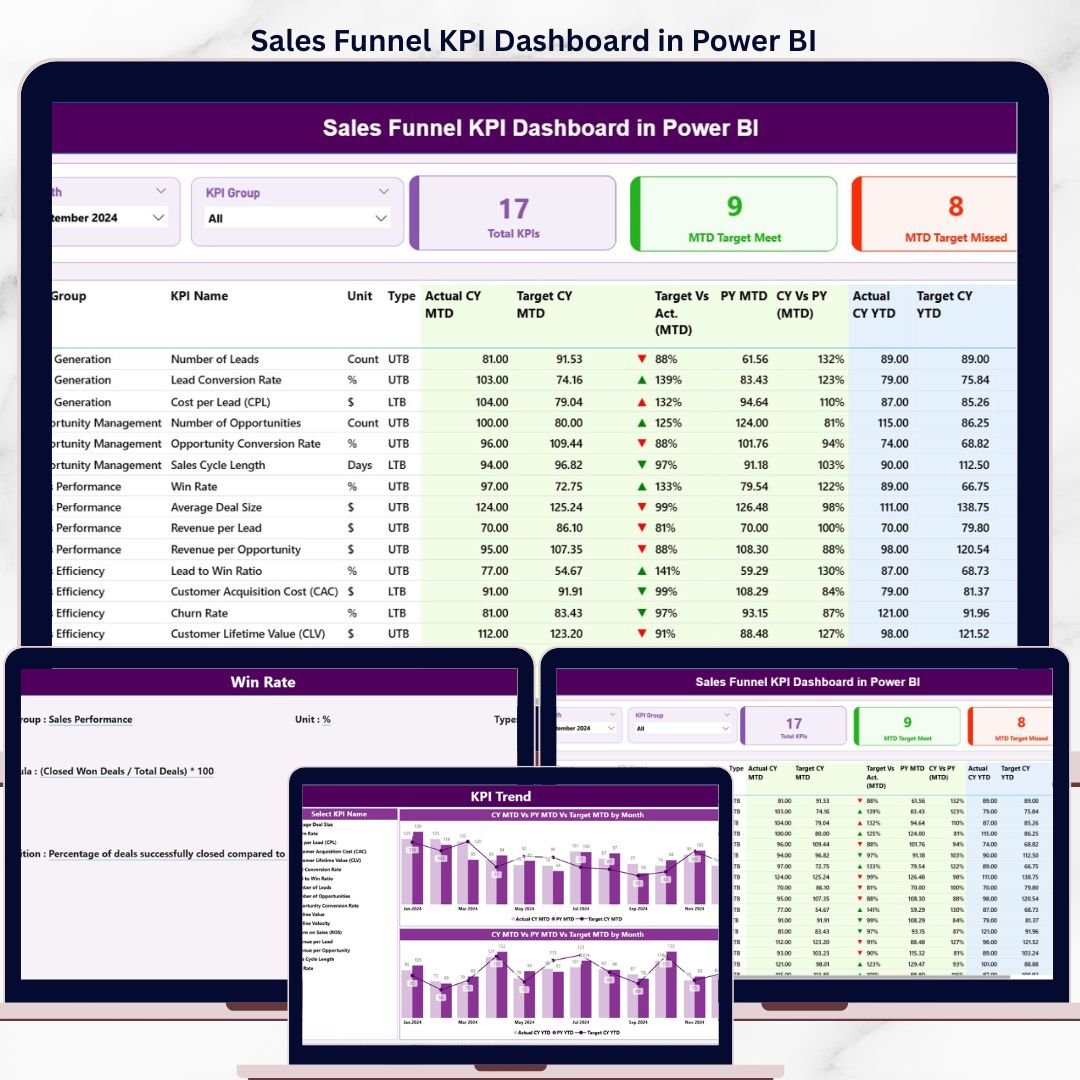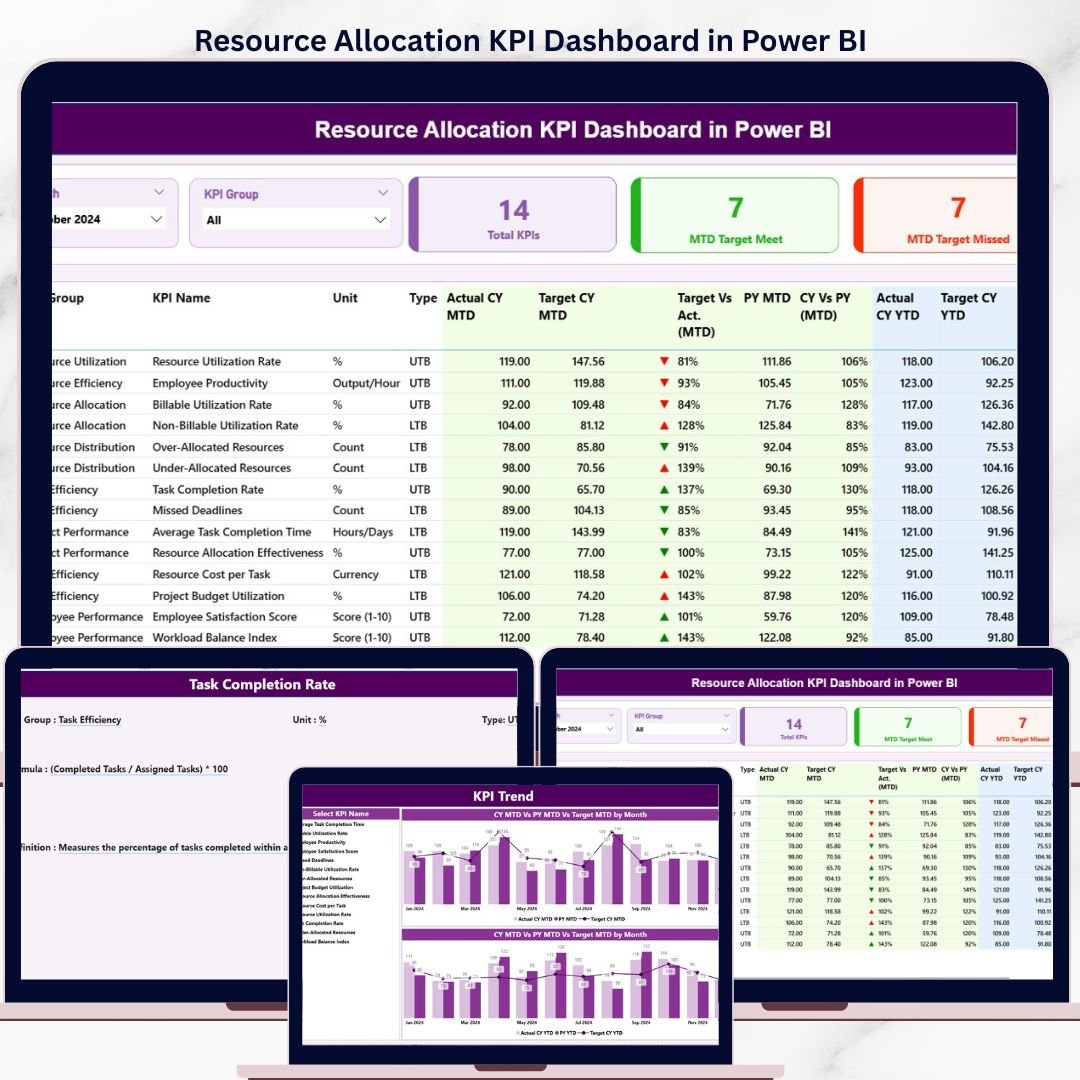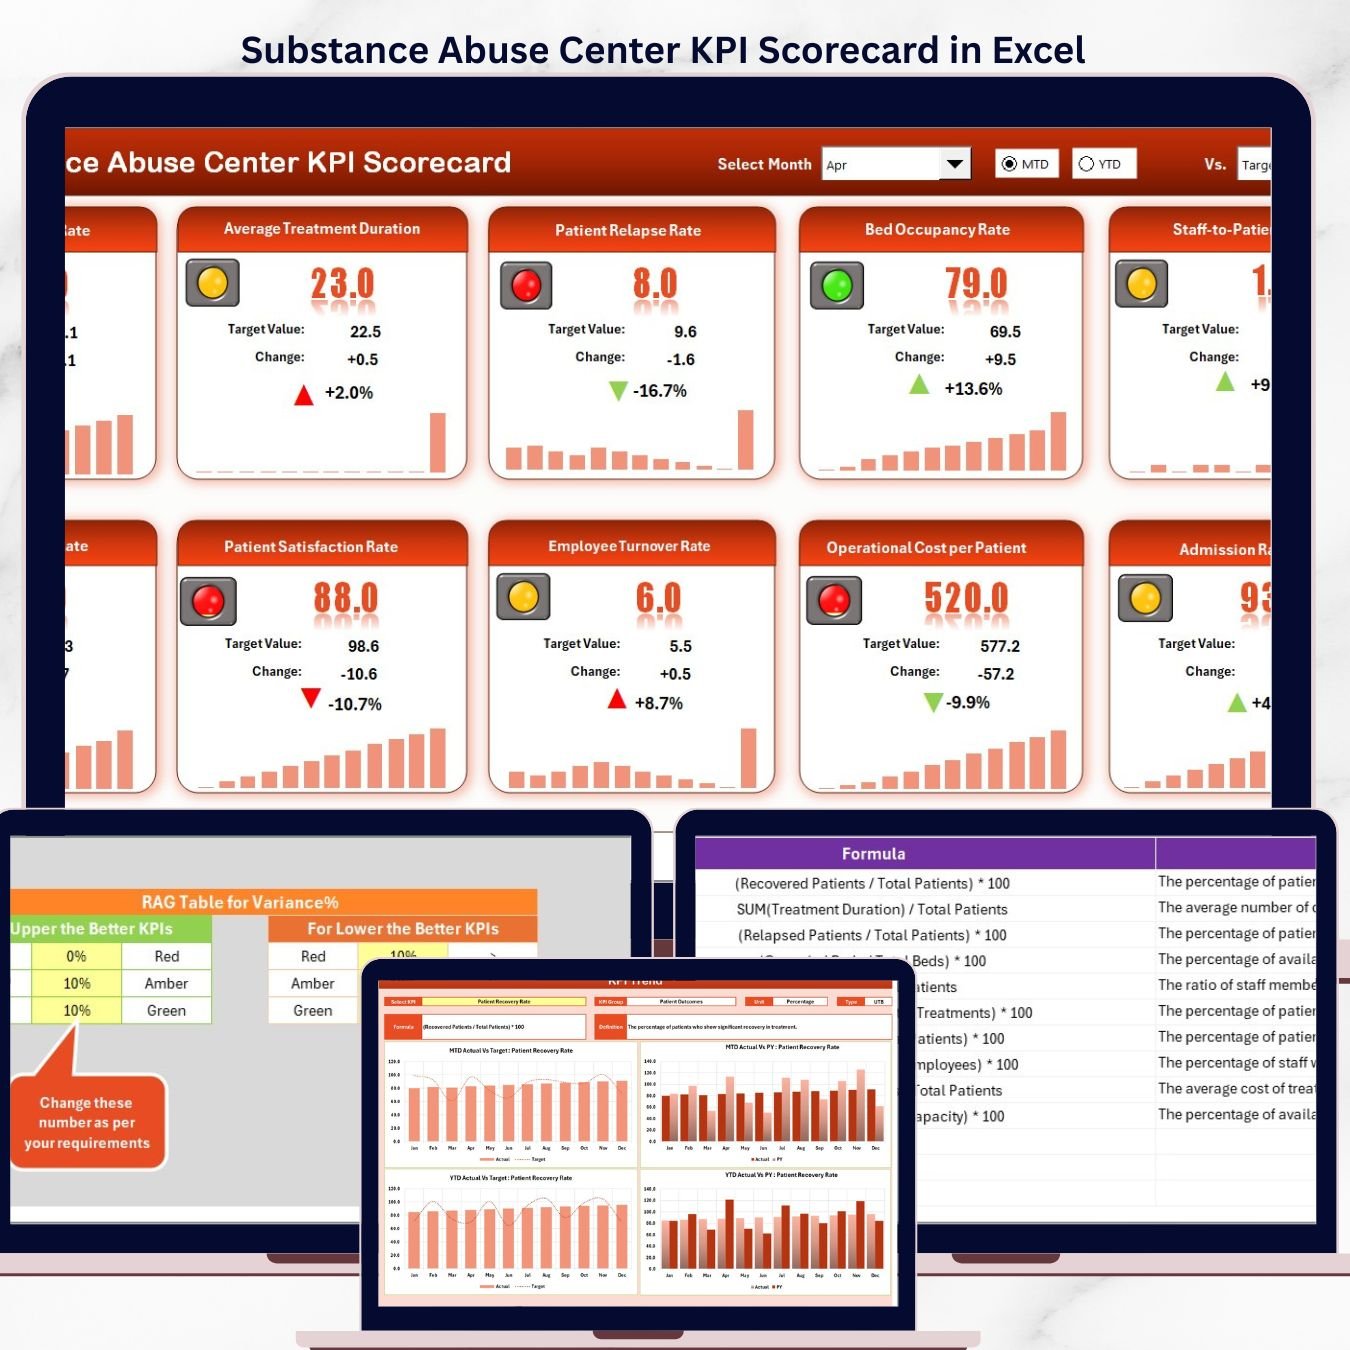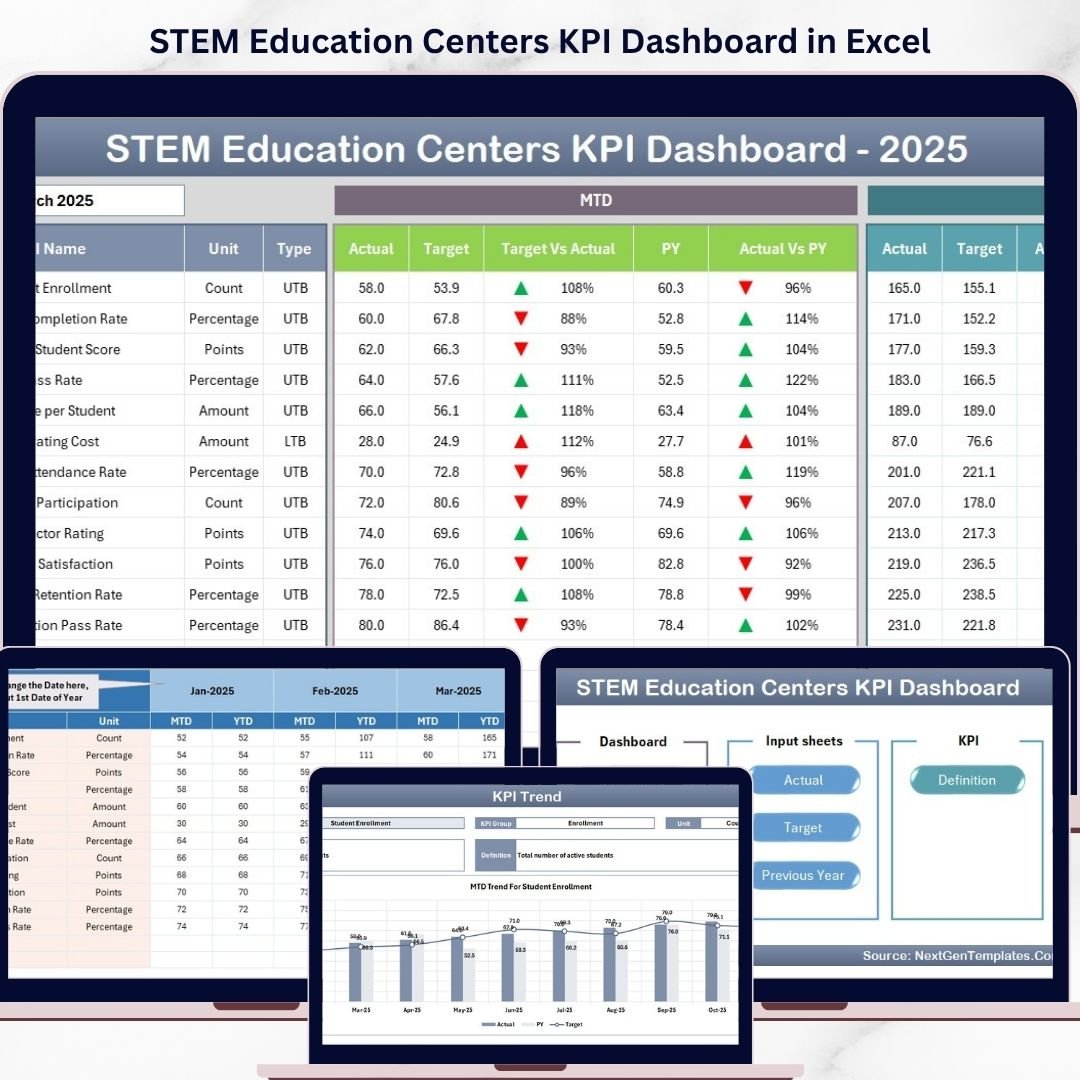
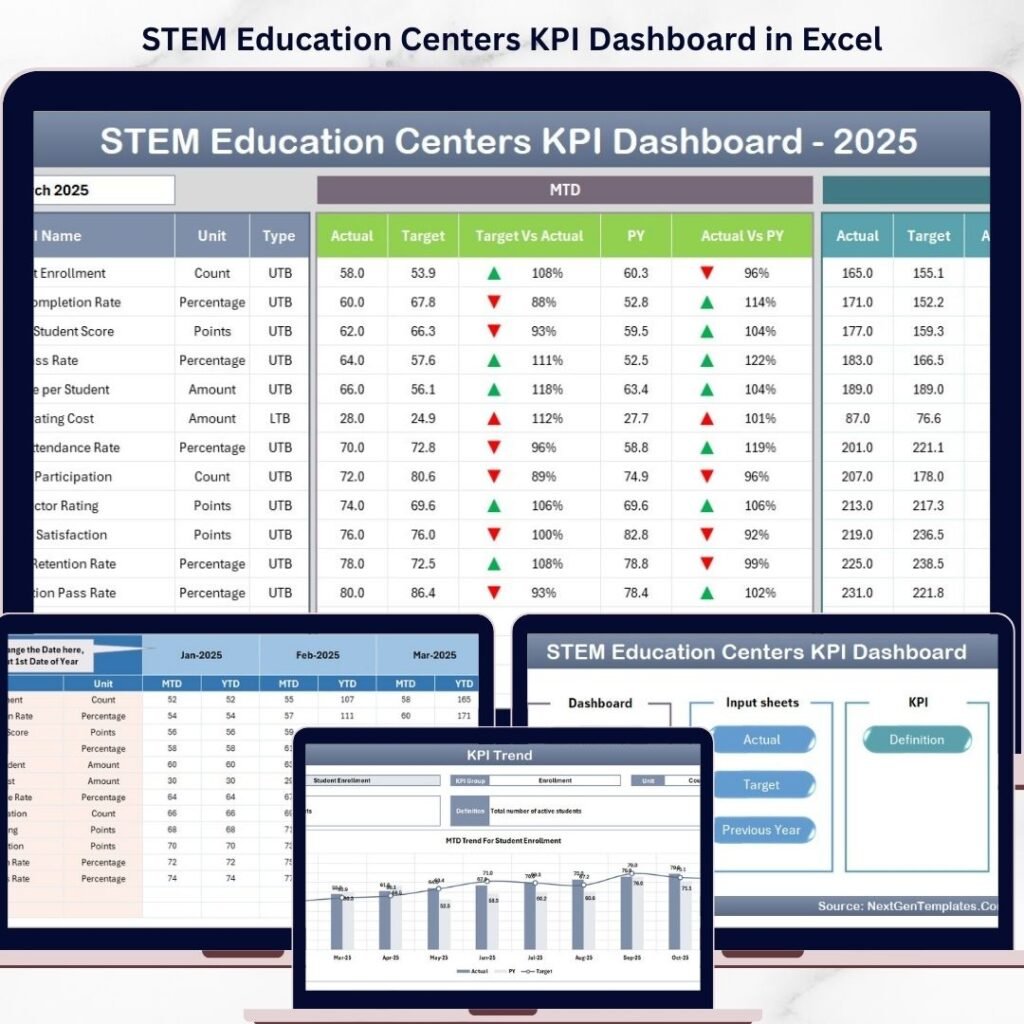
Managing a STEM education center requires continuous monitoring of student performance, program effectiveness, and operational efficiency. However, when data is scattered across multiple files and reports, it becomes difficult to track KPIs and make timely decisions. STEM Education Centers KPI Dashboard in Excel becomes your ultimate solution. This ready-to-use and professionally designed Excel dashboard helps you track, analyze, and optimize key performance indicators (KPIs) in one centralized place. Instead of spending hours compiling reports, you can now access real-time insights and make smarter, data-driven decisions with ease. Whether you want to monitor Month-to-Date (MTD) progress, evaluate Year-to-Date (YTD) performance, or compare current data with previous year trends, this dashboard provides everything you need in a simple and interactive format. STEM Education Centers KPI Dashboard in Excel �� Key Features of STEM Education Centers KPI Dashboard in Excel �� Interactive KPI Dashboard – View all critical KPIs in one centralized and dynamic dashboard.�� MTD & YTD Performance Tracking – Compare Actual, Target, and Previous Year data effortlessly.�� Trend Analysis Charts – Visualize performance trends with clear and interactive charts.�� Conditional Formatting Indicators – Instantly identify KPI performance using visual arrows.�� 7 Structured Worksheets – Organized sheets for smooth data entry and analysis.�� Dynamic Dropdown Filters – Analyze KPIs using interactive selection options.�� Detailed KPI Definitions – Understand each KPI with formulas, units, and performance types (LTB/UTB).⚡ Easy Navigation System – Navigate across sheets using the Home page buttons. �� What’s Inside the STEM Education Centers KPI Dashboard in Excel This dashboard includes 7 well-organized worksheets for complete KPI tracking and analysis: �� Home SheetActs as a navigation hub with clickable buttons to access different sections quickly. �� Dashboard SheetDisplays all KPIs with MTD and YTD Actual, Target, and Previous Year comparisons along with performance indicators. �� KPI Trend SheetAnalyze specific KPIs with detailed information including KPI group, unit, formula, and trend charts. �� Actual Numbers Input SheetEnter actual KPI data for accurate tracking and reporting. �� Target Numbers Input SheetSet performance targets and compare results effectively. �� Previous Year Data SheetCompare current performance with historical data for deeper insights. �� KPI Definition SheetMaintain KPI formulas, definitions, and classifications for clarity and consistency. ��️ How to Use the STEM Education Centers KPI Dashboard in Excel Using this dashboard is simple and efficient: 1️⃣ Enter data into Actual, Target, and Previous Year sheets2️⃣ Adjust the starting month if required3️⃣ Select the month from the Dashboard dropdown4️⃣ Analyze MTD and YTD KPIs instantly5️⃣ Use the KPI Trend sheet for deeper analysis6️⃣ Monitor trends and identify improvement areas7️⃣ Take action based on data-driven insights Within minutes, you can convert raw data into meaningful insights. �� Who Can Benefit from This STEM Education Centers KPI Dashboard in Excel This dashboard is ideal for: ���� STEM Education Center Managers tracking performance and outcomes�� Data Analysts analyzing KPIs and trends���� Administrators managing operations and reporting�� Program Coordinators evaluating program success�� Consultants optimizing educational performance Whether you manage a small learning center or a large STEM institution, this dashboard helps you stay organized and focused on growth. With this dashboard, you eliminate the need for manual reporting and complex calculations. Everything is automated, structured, and easy to understand. As a result, you save time, improve accuracy, and make faster decisions. So, if you want to enhance performance tracking, improve educational outcomes, and manage your STEM center efficiently, this dashboard is the perfect solution. Click here to read the Detailed blog post Visit our YouTube channel to learn step-by-step video tutorials �� https://www.youtube.com/@PKAnExcelExpert